
Simple diagram of greenhouse effect
Greenhouse gases are gases in an atmosphere that absorb and emit radiation within the thermal infrared range. This process is the fundamental cause of the greenhouse effect.[1] The main greenhouse gases in the Earth's atmosphere are water vapor, carbon dioxide, methane, nitrous oxide, and ozone. In our solar system, the atmospheres of Venus, Mars and Titan also contain gases that cause greenhouse effects. Greenhouse gases greatly affect the temperature of the Earth; without them, Earth's surface would be on average about 33 °C (59 °F)[note 1] colder than at present.[2][3][4]
The burning of fossil fuels since the beginning of the Industrial revolution has substantially increased the levels of carbon dioxide in the atmosphere.[5]
Greenhouse effects in Earth's atmosphere[]
- Main article: Greenhouse effect
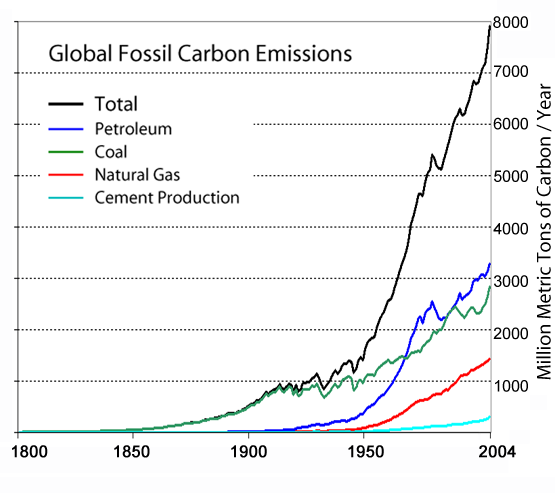
Modern global anthropogenic Carbon emissions.
In order, Earth's most abundant greenhouse gases are:
- water vapor
- carbon dioxide
- atmospheric methane
- nitrous oxide
- ozone
- chlorofluorocarbons
The contribution to the greenhouse effect by a gas is affected by both the characteristics of the gas and its abundance. For example, on a molecule-for-molecule basis methane is about eighty times stronger greenhouse gas than carbon dioxide [6], but it is present in much smaller concentrations so that its total contribution is smaller. When these gases are ranked by their contribution to the greenhouse effect, the most important are:[7]
- water vapor, which contributes 36–72%
- carbon dioxide, which contributes 9–26%
- methane, which contributes 4–9%
- ozone, which contributes 3–7%
It is not possible to state that a certain gas causes an exact percentage of the greenhouse effect. This is because some of the gases absorb and emit radiation at the same frequencies as others, so that the total greenhouse effect is not simply the sum of the influence of each gas. The higher ends of the ranges quoted are for each gas alone; the lower ends account for overlaps with the other gases.[7][8] The major non-gas contributor to the Earth's greenhouse effect, clouds, also absorb and emit infrared radiation and thus have an effect on radiative properties of the greenhouse gases.[7][8]
In addition to the main greenhouse gases listed above, other greenhouse gases include sulfur hexafluoride, hydrofluorocarbons and perfluorocarbons (see IPCC list of greenhouse gases). Some greenhouse gases are not often listed. For example, nitrogen trifluoride has a high global warming potential (GWP) but is only present in very small quantities.[9]

Atmospheric absorption and scattering at different electromagnetic wavelengths. The largest absorption band of carbon dioxide is in the infrared.
Scientists who have elaborated on Arrhenius' theory of global warming are concerned that increasing concentrations of greenhouse gases in the atmosphere are causing an unprecedented rise in global temperatures, with potentially harmful consequences for the environment and human health.[10] Although contributing to many other physical and chemical reactions, the major atmospheric constituents, nitrogen (N2), oxygen (O2), and argon (Ar), are not greenhouse gases. This is because molecules containing two atoms of the same element such as N2 and O2 and monatomic molecules such as Ar have no net change in their dipole moment when they vibrate and hence are almost totally unaffected by infrared light. Although molecules containing two atoms of different elements such as carbon monoxide (CO) or hydrogen chloride (HCl) absorb IR, these molecules are short-lived in the atmosphere owing to their reactivity and solubility. As a consequence they do not contribute significantly to the greenhouse effect and are not often included when discussing greenhouse gases.
Late 19th century scientists experimentally discovered that N2 and O2 did not absorb infrared radiation (called, at that time, "dark radiation") and that water as a vapour and in cloud form, CO2 and many other gases did absorb such radiation. It was recognized in the early 20th century that the greenhouse gases in the atmosphere caused the Earth's overall temperature to be higher than it would be without them.
Natural and anthropogenic[]


400,000 years of ice core data

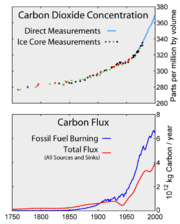
Top: Increasing atmospheric carbon dioxide levels as measured in the atmosphere and reflected in ice cores. Bottom: The amount of net carbon increase in the atmosphere, compared to carbon emissions from burning fossil fuel.
Aside from purely human-produced synthetic halocarbons, most greenhouse gases have both natural and human-caused sources. During the pre-industrial Holocene, concentrations of existing gases were roughly constant. In the industrial era, human activities have added greenhouse gases to the atmosphere, mainly through the burning of fossil fuels and clearing of forests.[11][12]
The 2007 Fourth Assessment Report compiled by the IPCC (AR4) noted that "changes in atmospheric concentrations of greenhouse gases and aerosols, land cover and solar radiation alter the energy balance of the climate system", and concluded that "increases in anthropogenic greenhouse gas concentrations is very likely to have caused most of the increases in global average temperatures since the mid-20th century".[13] In AR4, "most of" is defined as more than 50%.
| Gas | Preindustrial level | Current level | Increase since 1750 | Radiative forcing (W/m2) |
|---|---|---|---|---|
| Carbon dioxide | 280 ppm | 387ppm | 107 ppm | 1.46 |
| Methane | 700 ppb | 1745 ppb | 1045 ppb | 0.48 |
| Nitrous oxide | 270 ppb | 314 ppb | 44 ppb | 0.15 |
| CFC-12 | 0 | 533 ppt | 533 ppt | 0.17 |
Ice cores provide evidence for variation in greenhouse gas concentrations over the past 800,000 years. Both CO2 and CH4 vary between glacial and interglacial phases, and concentrations of these gases correlate strongly with temperature. Before the ice core record, direct data does not exist. However, various proxies and modelling suggests large variations; 500 million years ago CO2 levels were likely 10 times higher than now.[14] Indeed higher CO2 concentrations are thought to have prevailed throughout most of the Phanerozoic eon, with concentrations four to six times current concentrations during the Mesozoic era, and ten to fifteen times current concentrations during the early Palaeozoic era until the middle of the Devonian period, about 400 Ma.[15][16][17] The spread of land plants is thought to have reduced CO2 concentrations during the late Devonian, and plant activities as both sources and sinks of CO2 have since been important in providing stabilising feedbacks.[18] Earlier still, a 200-million year period of intermittent, widespread glaciation extending close to the equator (Snowball Earth) appears to have been ended suddenly, about 550 Ma, by a colossal volcanic outgassing which raised the CO2 concentration of the atmosphere abruptly to 12%, about 350 times modern levels, causing extreme greenhouse conditions and carbonate deposition as limestone at the rate of about 1 mm per day.[19] This episode marked the close of the Precambrian eon, and was succeeded by the generally warmer conditions of the Phanerozoic, during which multicellular animal and plant life evolved. No volcanic carbon dioxide emission of comparable scale has occurred since. In the modern era, emissions to the atmosphere from volcanoes are only about 1% of emissions from human sources.[19][20]
Anthropogenic greenhouse gases[]

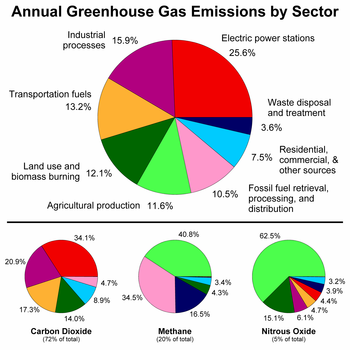
Global anthropogenic greenhouse gas emissions broken down into 8 different sectors for the year 2000.
The projected temperature increase for a range of greenhouse gas stabilization scenarios (the coloured bands). The black line in middle of the shaded area indicates 'best estimates'; the red and the blue lines the likely limits. From the work of IPCC AR4, 2007.


Per capita anthropogenic greenhouse gas emissions by country for the year 2000 including land-use change.
Since about 1750 human activity has increased the concentration of carbon dioxide and other greenhouse gases. Measured atmospheric concentrations of carbon dioxide are currently 100 ppmv higher than pre-industrial levels.[21] Natural sources of carbon dioxide are more than 20 times greater than sources due to human activity,[22] but over periods longer than a few years natural sources are closely balanced by natural sinks such as weathering of continental rocks and photosynthesis of carbon compounds by plants and marine plankton. As a result of this balance, the atmospheric concentration of carbon dioxide remained between 260 and 280 parts per million for the 10,000 years between the end of the last glacial maximum and the start of the industrial era.[23]
It is likely that anthropogenic warming, such as that due to elevated greenhouse gas levels, has had a discernible influence on many physical and biological systems. Warming is projected to affect various issues such as freshwater resources, industry, food and health.[24]
The main sources of greenhouse gases due to human activity are:
- burning of fossil fuels and deforestation leading to higher carbon dioxide concentrations. Land use change (mainly deforestation in the tropics) account for up to one third of total anthropogenic CO2 emissions.[23]
- livestock enteric fermentation and manure management,[25] paddy rice farming, land use and wetland changes, pipeline losses, and covered vented landfill emissions leading to higher methane atmospheric concentrations. Many of the newer style fully vented septic systems that enhance and target the fermentation process also are sources of atmospheric methane.
- use of chlorofluorocarbons (CFCs) in refrigeration systems, and use of CFCs and halons in fire suppression systems and manufacturing processes.
- agricultural activities, including the use of fertilizers, that lead to higher nitrous oxide (N2O) concentrations.
The seven sources of CO2 from fossil fuel combustion are (with percentage contributions for 2000–2004):[26]
- Solid fuels (e.g., coal): 35%
- Liquid fuels (e.g., gasoline, fuel oil): 36%
- Gaseous fuels (e.g., natural gas): 20%
- Flaring gas industrially and at wells: <1%
- Cement production: 3%
- Non-fuel hydrocarbons: < 1%
- The "international bunkers" of shipping and air transport not included in national inventories: 4%
The US Environmental Protection Agency (EPA) ranks the major greenhouse gas contributing end-user sectors in the following order: industrial, transportation, residential, commercial and agricultural.[27] Major sources of an individual's greenhouse gas include home heating and cooling, electricity consumption, and transportation. Corresponding conservation measures are improving home building insulation, installing geothermal heat pumps and compact fluorescent lamps, and choosing energy-efficient vehicles.
Carbon dioxide, methane, nitrous oxide and three groups of fluorinated gases (sulfur hexafluoride, HFCs, and PFCs) are the major greenhouse gases and the subject of the Kyoto Protocol, which came into force in 2005.[28]
Although CFCs are greenhouse gases, they are regulated by the Montreal Protocol, which was motivated by CFCs' contribution to ozone depletion rather than by their contribution to global warming. Note that ozone depletion has only a minor role in greenhouse warming though the two processes often are confused in the media.
On December 7, 2009, the US Environmental Protection Agency released its final findings on greenhouse gases, declaring that "greenhouse gases (GHGs) threaten the public health and welfare of the American people". The finding applied to the same "six key well-mixed greenhouse gases" named in the Kyoto Protocol: carbon dioxide, methane, nitrous oxide, hydrofluorocarbons, perfluorocarbons, and sulfur hexafluoride.[29][30]
Role of water vapor[]
- Main article: water vapor


Increasing water vapor in the stratosphere at Boulder, Colorado.
Water vapor accounts for the largest percentage of the greenhouse effect, between 36% and 66% for water vapor alone, and between 66% and 85% when factoring in clouds.[8] However, the warming due to the greenhouse effect of cloud cover is, at least in part, mitigated by the change in the Earth's albedo. According to NASA, "The overall effect of all clouds together is that the Earth's surface is cooler than it would be if the atmosphere had no clouds." (cf. NASA Clouds and Radiation) Water vapor concentrations fluctuate regionally, but human activity does not significantly affect water vapor concentrations except at local scales, such as near irrigated fields. According to the Environmental Health Center of the National Safety Council, water vapor constitutes as much as 2% of the atmosphere.[31]
The Clausius-Clapeyron relation establishes that air can hold more water vapor per unit volume when it warms. This and other basic principles indicate that warming associated with increased concentrations of the other greenhouse gases also will increase the concentration of water vapor.
When a warming trend results in effects that induce further warming, the process is referred to as a "positive feedback"; this amplifies the original warming. When the warming trend results in effects that induce cooling, the process is referred to as a "negative feedback"; this reduces the original warming. Because water vapor is a greenhouse gas and because warm air can hold more water vapor than cooler air, the primary positive feedback involves water vapor. This positive feedback does not result in runaway global warming because it is offset by other processes that induce negative feedbacks, which stabilizes average global temperatures. The primary negative feedback is the effect of temperature on emission of infrared radiation: as the temperature of a body increases, the emitted radiation increases with the fourth power of its absolute temperature.[32]
Other important considerations involve water vapor being the only greenhouse gas whose concentration is highly variable in space and time in the atmosphere and the only one that also exists in both liquid and solid phases, frequently changing to and from each of the three phases or existing in mixes. Such considerations include clouds themselves, air and water vapor density interactions when they are the same or different temperatures, the absorption and release of kinetic energy as water evaporates and condenses to and from vapor, and behaviors related to vapor partial pressure. For example, the release of latent heat by rain in the ITCZ drives atmospheric circulation, clouds vary atmospheric albedo levels, and the oceans provide evaporative cooling that modulates the greenhouse effect down from estimated 67 °C surface temperature.[4][33]
- See also water, water (molecule).
Greenhouse gas emissions[]
- Main article: List of countries by carbon dioxide emissions
Measurements from Antarctic ice cores show that before industrial emissions started atmospheric CO2 levels were about 280 parts per million by volume (ppmv), and stayed between 260 and 280 during the preceding ten thousand years.[34] Carbon dioxide concentrations in the atmosphere have gone up by approximately 35 percent since the 1900s, rising from 280 parts per million by volume to 387 parts per million in 2009. One study using evidence from stomata of fossilized leaves suggests greater variability, with carbon dioxide levels above 300 ppm during the period seven to ten thousand years ago[35], though others have argued that these findings more likely reflect calibration or contamination problems rather than actual CO2 variability.[36][37] Because of the way air is trapped in ice (pores in the ice close off slowly to form bubbles deep within the firn) and the time period represented in each ice sample analyzed, these figures represent averages of atmospheric concentrations of up to a few centuries rather than annual or decadal levels.


Recent year-to-year increase of atmospheric CO2
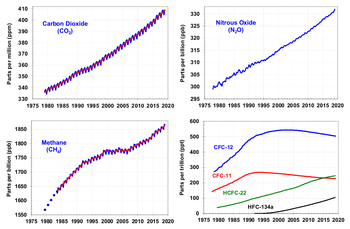
Since the beginning of the Industrial Revolution, the concentrations of most of the greenhouse gases have increased. For example, the concentration of carbon dioxide has increased by about 36% to 380 ppmv, or 100 ppmv over modern pre-industrial levels. The first 50 ppmv increase took place in about 200 years, from the start of the Industrial Revolution to around 1973; however the next 50 ppmv increase took place in about 33 years, from 1973 to 2006.[38]
Recent data also shows that the concentration is increasing at a higher rate. In the 1960s, the average annual increase was only 37% of what it was in 2000 through 2007.[39]
The other greenhouse gases produced from human activity show similar increases in both amount and rate of increase. Many observations are available online in a variety of Atmospheric Chemistry Observational Databases.
| Gas | Current (1998) Amount by volume | Increase (ppm) over pre-industrial (1750) |
Increase (%) over pre-industrial (1750) |
Radiative forcing (W/m2) |
|---|---|---|---|---|
| Carbon dioxide | 365 ppm (383 ppm, 2007.01) |
87 ppm (105 ppm, 2007.01) |
31% (38%, 2007.01) |
1.46 (~1.53, 2007.01) |
| Methane | 1745 ppb | 1045 ppb | 67% | 0.48 |
| Nitrous oxide | 314 ppb | 44 ppb | 16% | 0.15 |
| Gas | Current (1998) Amount by volume |
Radiative forcing (W/m2) |
|---|---|---|
| CFC-11 | 268 ppt | 0.07 |
| CFC-12 | 533 ppt | 0.17 |
| CFC-113 | 84 ppt | 0.03 |
| Carbon tetrachloride | 102 ppt | 0.01 |
| HCFC-22 | 69 ppt | 0.03 |
(Source: IPCC radiative forcing report 1994 updated (to 1998) by IPCC TAR table 6.1[40][41] ).
Regional and national attribution of emissions[]

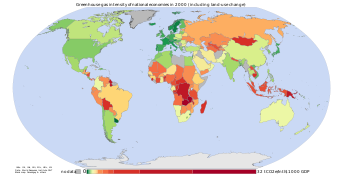
Greenhouse gas intensity in 2000 including land-use change


Per capita responsibility for current anthropogenic atmospheric CO2

Major greenhouse gas trends
There are several different ways of measuring GHG emissions (see World Bank (2010, p. 362) for a table of national emissions data).[42] The different measures are sometimes used by different countries in asserting various policy/ethical positions to do with climate change (Banuri et al., 1996, p. 94).[43] Emissions may be measured over long time periods. This measurement type is called historical or cumulative emissions. Cumulative emissions give some indication of who is responsible for the build-up in the atmospheric concentration of GHGs (IEA, 2007, p. 199).[44]
Emissions may also be measured across shorter time periods. Emissions changes may, for example, be measured against a base year of 1990. 1990 was used in the United Nations Framework Convention on Climate Change (UNFCCC) as the base year for emissions, and is also used in the Kyoto Protocol (some gases are also measured from the year 1995) (Grubb, 2003, pp. 146, 149).[45] A country's emissions may also be reported as a proportion of global emissions for a particular year.
Another measurement is of per capita emissions. This divides a country's total annual emissions by its mid-year population (World Bank, 2010, p. 370). Per capita emissions may be based on historical or annual emissions (Banuri et al., 1996, pp. 106–107).
Cumulative emissions
Over the 1900-2005 period, the US was the world's largest cumulative emitter of energy-related CO2 emissions, and accounted for 30% of total cumulative emissions (IEA, 2007, p. 201).[44] The second largest emitter was the EU, at 23%; the third largest was China, at 8%; fourth was Japan, at 4%; fifth was India, at 2%. The rest of the world accounted for 33% of global, cumulative, energy-related CO2 emissions.
Changes since a particular base year
In total, Annex I Parties managed a cut of 3.3% in GHG emissions between 1990 and 2004 (UNFCCC, 2007, p. 11).[46] Annex I Parties are those countries listed in Annex I of the UNFCCC, and are the industrialized countries. For non-Annex I Parties, emissions in several large developing countries and fast growing economies (China, India, Thailand, Indonesia, Egypt, and Iran) GHG emissions have increased rapidly over this period (PBL, 2009).[47]
The sharp acceleration in CO2 emissions since 2000 to more than a 3% increase per year (more than 2 ppm per year) from 1.1% per year during the 1990s is attributable to the lapse of formerly declining trends in carbon intensity of both developing and developed nations. China was responsible for most of global growth in emissions during this period. Localised plummeting emissions associated with the collapse of the Soviet Union have been followed by slow emissions growth in this region due to more efficient energy use, made necessary by the increasing proportion of it that is exported.[26] In comparison, methane has not increased appreciably, and N2O by 0.25% y−1.
Annual and per capita emissions
At the present time, total annual emissions of GHGs are rising (Rogner et al., 2007).[48] Between the period 1970 to 2004, emissions increased at an average rate of 1.6% per year, with CO2 emissions from the use of fossil fuels growing at a rate of 1.9% per year.
Per capita emissions in the industrialized countries are typically as much as ten times the average in developing countries (Grubb, 2003, p. 144).[45] Due to China's fast economic development, its per capita emissions are quickly approaching the levels of those in the Annex I group of the Kyoto Protocol (PBL, 2009).[49] Other countries with fast growing emissions are South Korea, Iran, and Australia. On the other hand, per capita emissions of the EU-15 and the USA are gradually decreasing over time. Emissions in Russia and the Ukraine have decreased fastest since 1990 due to economic restructuring in these countries (Carbon Trust, 2009, p. 24).[50]
Energy statistics for fast growing economies are less accurate than those for the industrialized countries. For China's annual emissions in 2008, PBL (2008) estimated an uncertainty range of about 10%.
Top emitters
In 2005, the world's top-20 emitters comprised 80% of total GHG emissions (PBL, 2010. See notes for the following table).[51] Listed below are the top-5 emitters for the year 2005 (MNP, 2007).[52] The first figure is the country's or region's share of the global total of annual emissions. The second figure is the country's or region's average annual per capita emissions, in tonnes of GHG per head of population:
- China1 – 17%, 5.8
- United States ® – 16%, 24.1
- European Union-27 ® – 11%, 10.6
- Indonesia2 - 6%, 12.9
- India – 5%, 2.1
Notes
- These values are for the GHG emissions from fossil fuel use and cement production. Calculations are for carbon dioxide (CO2), methane (CH4), nitrous oxide (N2O) and gases containing fluorine (the F-gases HFCs, PFCs and SF6).
- These estimates are subject to large uncertainties regarding CO2 emissions from deforestation; and the per country emissions of other GHGs (e.g., methane). There are also other large uncertainties which mean that small differences between countries are not significant. CO2 emissions from the decay of remaining biomass after biomass burning/deforestation are not included.
- Industrialised countries: official country data reported to UNFCCC ( ® )
- 1 excluding underground fires. 2 including an estimate of 2000 million tonnes CO2 from peat fires and decomposition of peat soils after draining. However, the uncertainty range is very large.
Effect of policy
Rogner et al. (2007) assessed the effectiveness of policies to reduce emissions (mitigation of climate change).[48] They concluded that mitigation policies undertaken by UNFCCC Parties were inadequate to reverse the trend of increasing GHG emissions. The impacts of population growth, economic development, technological investment, and consumption had overwhelmed improvements in energy intensities and efforts to decarbonize (energy intensity is a country's total primary energy supply (TPES) per unit of GDP (Rogner et al., 2007).[53] TPES is a measure of commercial energy consumption (World Bank, 2010, p. 371)).[42]
Projections
Based on then-current energy policies, Rogner et al. (2007) projected that energy-related CO2 emissions in 2030 would be 40-110% higher than in 2000.[48] Two-thirds of this increase was projected to come from non-Annex I countries. Per capita emissions in Annex I countries were still projected to remain substantially higher than per capita emissions in non-Annex I countries. Projections consistently showed a 25-90% increase in the Kyoto gases (carbon dioxide, methane, nitrous oxide, sulphur hexafluoride) compared to 2000.
Relative CO2 emission from various fuels[]
| Fuel name | CO2 emitted (lbs/106 Btu) | CO2 emitted (g/106 J) |
|---|---|---|
| Natural gas | 117 | 50.30 |
| Liquefied petroleum gas | 139 | 59.76 |
| Propane | 139 | 59.76 |
| Aviation gasoline | 153 | 65.78 |
| Automobile gasoline | 156 | 67.07 |
| Kerosene | 159 | 68.36 |
| Fuel oil | 161 | 69.22 |
| Tires/tire derived fuel | 189 | 81.26 |
| Wood and wood waste | 195 | 83.83 |
| Coal (bituminous) | 205 | 88.13 |
| Coal (subbituminous) | 213 | 91.57 |
| Coal (lignite) | 215 | 92.43 |
| Petroleum coke | 225 | 96.73 |
| Coal (anthracite) | 227 | 97.59 |
Removal from the atmosphere and global warming potential[]
Natural processes[]
Greenhouse gases can be removed from the atmosphere by various processes:
- as a consequence of a physical change (condensation and precipitation remove water vapor from the atmosphere).

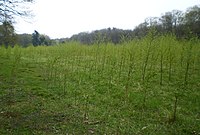
"Internet forest" in the Netherlands, meant to compensate for the CO2 emission caused by internet servers
- as a consequence of chemical reactions within the atmosphere. For example, methane is oxidized by reaction with naturally occurring hydroxyl radical, OH· and degraded to CO2 and water vapor (CO2 from the oxidation of methane is not included in the methane Global warming potential). Other chemical reactions include solution and solid phase chemistry occurring in atmospheric aerosols.
- as a consequence of a physical exchange between the atmosphere and the other compartments of the planet. An example is the mixing of atmospheric gases into the oceans.
- as a consequence of a chemical change at the interface between the atmosphere and the other compartments of the planet. This is the case for CO2, which is reduced by photosynthesis of plants, and which, after dissolving in the oceans, reacts to form carbonic acid and bicarbonate and carbonate ions (see ocean acidification).
- as a consequence of a photochemical change. Halocarbons are dissociated by UV light releasing Cl· and F· as free radicals in the stratosphere with harmful effects on ozone (halocarbons are generally too stable to disappear by chemical reaction in the atmosphere).
Atmospheric lifetime[]
Aside from water vapor, which has a residence time of about nine days, major greenhouse gases are well-mixed, and take many years to leave the atmosphere.[55] Although it is not easy to know with precision how long it takes greenhouse gases to leave the atmosphere, there are estimates for the principal greenhouse gases. Jacob (1999)[56] defines the lifetime of an atmospheric species X in a one-box model as the average time that a molecule of X remains in the box. Mathematically can be defined as the ratio of the mass (in kg) of X in the box to its removal rate, which is the sum of the flow of X out of the box (), chemical loss of X (), and deposition of X () (all in kg/sec): [56]


The atmospheric lifetime of a species therefore measures the time required to restore equilibrium following an increase in its concentration in the atmosphere. Individual atoms or molecules may be lost or deposited to sinks such as the soil, the oceans and other waters, or vegetation and other biological systems, reducing the excess to background concentrations. The average time taken to achieve this is the mean lifetime. The atmospheric lifetime of CO2 is often incorrectly stated to be only a few years because that is the average time for any CO2 molecule to stay in the atmosphere before being removed by mixing into the ocean, photosynthesis, or other processes. However, this ignores the balancing fluxes of CO2 into the atmosphere from the other reservoirs. It is the net concentration changes of the various greenhouse gases by all sources and sinks that determines atmospheric lifetime, not just the removal processes.[citation needed]
Global warming potential[]
The global warming potential (GWP) depends on both the efficiency of the molecule as a greenhouse gas and its atmospheric lifetime. GWP is measured relative to the same mass of CO2 and evaluated for a specific timescale. Thus, if a gas has a high GWP on a short time scale (say 20 years) but has only a short lifetime, it will have a large GWP on a 20 year scale but a small one on a 100 year scale. Conversely, if a molecule has a longer atmospheric lifetime than CO2 its GWP will increase with the timescale considered.
Examples of the atmospheric lifetime and GWP for several greenhouse gases include:[57]
- Carbon dioxide has a variable atmospheric lifetime, and cannot be specified precisely.[58] Recent work indicates that recovery from a large input of atmospheric CO2 from burning fossil fuels will result in an effective lifetime of tens of thousands of years.[59][60] Carbon dioxide is defined to have a GWP of 1 over all time periods.
- Methane has an atmospheric lifetime of 12 ± 3 years and a GWP of 72 over 20 years, 25 over 100 years and 7.6 over 500 years. The decrease in GWP at longer times is because methane is degraded to water and CO2 through chemical reactions in the atmosphere.
- Nitrous oxide has an atmospheric lifetime of 114 years and a GWP of 289 over 20 years, 298 over 100 years and 153 over 500 years.
- CFC-12 has an atmospheric lifetime of 100 years and a GWP of 11000 over 20 years, 10900 over 100 years and 5200 over 500 years.
- HCFC-22 has an atmospheric lifetime of 12 years and a GWP of 5160 over 20 years, 1810 over 100 years and 549 over 500 years.
- Tetrafluoromethane has an atmospheric lifetime of 50,000 years and a GWP of 5210 over 20 years, 7390 over 100 years and 11200 over 500 years.
- Hexafluoroethane has an atmospheric lifetime of 10,000 years and a GWP of 8630 over 20 years, 12200 over 100 years and 18200 over 500 years.
- Sulphur hexafluoride has an atmospheric lifetime of 3,200 years and a GWP of 16300 over 20 years, 22800 over 100 years and 32600 over 500 years.
- Nitrogen trifluoride has an atmospheric lifetime of 740 years and a GWP of 12300 over 20 years, 17200 over 100 years and 20700 over 500 years.
The use of CFC-12 (except some essential uses) has been phased out due to its ozone depleting properties.[61] The phasing-out of less active HCFC-compounds will be completed in 2030.[62]
Airborne fraction[]
Airborne fraction (AF) is the proportion of an emission (e.g. CO2) remaining in the atmosphere after a specified time. Canadell (2007)[63] define the annual AF as the ratio of the atmospheric CO2 increase in a given year to that year’s total emissions, and calculate that of the average 9.1 PgC y−1 of total anthropogenic emissions from 2000 to 2006, the AF was 0.45. For CO2 the AF over the last 50 years (1956–2006) has been increasing at 0.25 ± 0.21%/year.[63]
Negative emissions[]
See bio-energy with carbon capture and storage, carbon dioxide air capture, geoengineering and greenhouse gas remediation
There exists a number of technologies which produce negative emissions of greenhouse gases. Most widely analysed are those which remove carbon dioxide from the atmosphere, either to geologic formations such as bio-energy with carbon capture and storage[64][65][66] and carbon dioxide air capture [66], or to the soil as in the case with biochar.[66] It has been pointed out by the IPCC, that many long-term climate scenario models require large scale manmade negative emissions in order to avoid serious climate change.[67]
Related effects[]


MOPITT 2000 global carbon monoxide
Carbon monoxide has an indirect radiative effect by elevating concentrations of methane and tropospheric ozone through scavenging of atmospheric constituents (e.g., the hydroxyl radical, OH) that would otherwise destroy them. Carbon monoxide is created when carbon-containing fuels are burned incompletely. Through natural processes in the atmosphere, it is eventually oxidized to carbon dioxide. Carbon monoxide has an atmospheric lifetime of only a few months[68] and as a consequence is spatially more variable than longer-lived gases.
Another potentially important indirect effect comes from methane, which in addition to its direct radiative impact also contributes to ozone formation. Shindell et al. (2005)[69] argue that the contribution to climate change from methane is at least double previous estimates as a result of this effect.[70]
See also[]
- Atmospheric Chemistry Observational Databases for links to freely available data.
- Atmospheric window
- Attribution of recent climate change
- List of countries by electricity production from renewable source
- Carbon emissions by country
- Carbon cycle
- Carbon dioxide sink
- Carbon Disclosure Project
- Carbon emissions reporting
- Carbon neutral
- Carbon Dioxide Information Analysis Center
- Carbon offset
- Carbon credit
- Clean Air Act
- Climate Group
- Integrated Carbon Observation System
- Effects of global warming
- Emission standard
- Environmental accounting
- Environmental agreements
- European Climate Change Programme
- External cost
- Greenhouse debt
- Global Atmosphere Watch
- Hydrogen economy
- Low-carbon fuel standard
- Massachusetts v. Environmental Protection Agency
- North American Carbon Program
- Physical properties of greenhouse gases
- Regional Greenhouse Gas Initiative
- Thailand Greenhouse Gas Management Organisation (Public Organisation)
- Virgin Earth Challenge
- Western Regional Climate Action Initiative
- World energy resources and consumption
- Zero carbon economy
- Zero emission vehicle
External links[]
| This article's use of external links may not follow Wikipedia's policies or guidelines. Please improve this article by removing excessive and inappropriate external links or by converting links into footnote references. (May 2010) |
Template:Wikisource
- Greenhouse gas at the Open Directory Project
- The NOAA Annual Greenhouse Gas Index (AGGI)
- Atmospheric spectra of GHGs and other trace gases
- Greenhouse Gases Sources, Levels, Study results — University of Michigan; eia.doe.gov findings
- How Much Greenhouse Gas Does the United States Emit?
- Greenhouse-gas reduction technologies for coal-fired power generation.
- Grist article on convenient summary from various sources incl IPCC of greenhouse gas emissions Convenient summary of Greenhouse gas emissions
- Carbon dioxide emissions
- International Energy Annual: Reserves
- International Energy Annual 2003: Carbon Dioxide Emissions
- International Energy Annual 2003: Notes and Sources for Table H.1co2 (Metric tons of carbon dioxide can be converted to metric tons of carbon equivalent by multiplying by 12/44)
- DOE — EIA — Alternatives to Traditional Transportation Fuels 1994 — Volume 2, Greenhouse Gas Emissions (includes "Greenhouse Gas Spectral Overlaps and Their Significance")
- Trends in Atmospheric Carbon Dioxide (NOAA)
- NOAA Paleoclimatology Program — Vostok Ice Core
- NOAA CMDL CCGG — Interactive Atmospheric Data Visualization NOAA CO2 data
- Carbon Dioxide Information Analysis Centre FAQ Includes links to Carbon Dioxide statistics
- Little Green Data Book 2007, World Bank. Lists CO2 statistics by country, including per capita and by country income class.
- Database of carbon emissions of power plants
- NASA's Orbiting Carbon Observatory
- Methane emissions
- BBC News — Thawing Siberian bogs are releasing more methane
- Methane-eating bug holds promise for cutting greenhouse gas. Media Release, GNS Science, New Zealand
Notes[]
- ↑ "IPCC AR4 SYR Appendix Glossary" (PDF). http://www.ipcc.ch/pdf/assessment-report/ar4/syr/ar4_syr_appendix.pdf. Retrieved 14 December 2008.
- ↑ Karl TR, Trenberth KE (2003). "Modern Global Climate Change". Science 302 (5651): 1719–23. doi:10.1126/science.1090228. PMID 14657489. http://www.sciencemag.org/cgi/content/abstract/302/5651/1719.
- ↑ Le Treut H, Somerville R, Cubasch U, Ding Y, Mauritzen C, Mokssit A, Peterson T and Prather M (2007) (PDF). Historical Overview of Climate Change Science In: Climate Change 2007: The Physical Science Basis. Contribution of Working Group I to the Fourth Assessment Report of the Intergovernmental Panel on Climate Change (Solomon S, Qin D, Manning M, Chen Z, Marquis M, Averyt KB, Tignor M and Miller HL, editors). Cambridge University Press. http://www.ipcc.ch/pdf/assessment-report/ar4/wg1/ar4-wg1-chapter1.pdf. Retrieved 14 December 2008.
- ↑ 4.0 4.1 NASA Science Mission Directorate article on the water cycle
- ↑ Frequently Asked Global Change Questions, Carbon Dioxide Information Analysis Center
- ↑ Houghton, John (4 May 2005). Global warming. Institute of Physics. p. 1362. http://stacks.iop.org/RoPP/68/1343.
- ↑ 7.0 7.1 7.2 Kiehl, J. T.; Kevin E. Trenberth (1997). "Earth’s Annual Global Mean Energy Budget" (PDF). Bulletin of the American Meteorological Society 78 (2): 197–208. doi:10.1175/1520-0477(1997)078<0197:EAGMEB>2.0.CO;2. http://www.atmo.arizona.edu/students/courselinks/spring04/atmo451b/pdf/RadiationBudget.pdf. Retrieved 1 May 2006.
- ↑ 8.0 8.1 8.2 "Water vapour: feedback or forcing?". RealClimate. 6 April 2005. http://www.realclimate.org/index.php?p=142. Retrieved 1 May 2006.
- ↑ Prather, Michael J.; J Hsu (2008). "NF3, the greenhouse gas missing from Kyoto". Geophysical Research Letters 35: L12810. doi:10.1029/2008GL034542.
- ↑ Opposing Viewpoints Resource Center. Detroit: Thomson Gale, 2005. From Opposing Viewpoints Resource Center.
- ↑ "Chapter 1 Historical Overview of Climate Change Science" (PDF). Climate Change 2007: The Physical Science Basis. Contribution of Working Group I to the Fourth Assessment Report of the Intergovernmental Panel on Climate Change. Intergovernmental Panel on Climate Change. 5 February 2007. http://www.ipcc.ch/pdf/assessment-report/ar4/wg1/ar4-wg1-chapter1.pdf. Retrieved 25 April 2008.
- ↑ Chapter 3, IPCC Special Report on Emissions Scenarios, 2000
- ↑ http://www.ipcc.ch/pdf/assessment-report/ar4/syr/ar4_syr_spm.pdf AR4 SYR SPM page 5
- ↑ Image:Phanerozoic Carbon Dioxide.png
- ↑ Berner, Robert A. (1994). "GEOCARB II: a revised model of atmospheric CO2 over Phanerozoic time". American Journal of Science 294: 56–91. ISSN 0002-9599. http://earth.geology.yale.edu/~ajs/1994/01.1994.02Berner.pdf.
- ↑ Royer, DL; RA Berner and DJ Beerling (2001). "Phanerozoic atmospheric CO2 change: evaluating geochemical and paleobiological approaches". Earth-Science Reviews 54: 349–92. doi:10.1016/S0012-8252(00)00042-8.
- ↑ Berner, Robert A.; Kothavala, Zavareth (2001). "GEOCARB III: a revised model of atmospheric CO2 over Phanerozoic time". American Journal of Science 301 (2): 182–204. doi:10.2475/ajs.301.2.182. http://www.geology.yale.edu/~ajs/2001/Feb/qn020100182.pdf.
- ↑ Beerling, DJ; Berner, RA (2005). "Feedbacks and the co-evolution of plants and atmospheric CO2". Proc. Natl. Acad. Sci. U.S.A. 102 (5): 1302–5. doi:10.1073/pnas.0408724102. PMID 15668402.
- ↑ 19.0 19.1 Hoffmann, PF; AJ Kaufman, GP Halverson, DP Schrag (1998). "A neoproterozoic snowball earth". Science 281 (5381): 1342–6. doi:10.1126/science.281.5381.1342. PMID 9721097. http://www.sciencemag.org/cgi/content/full/281/5381/1342.
- ↑ Gerlach, TM (1991). "Present-day CO2 emissions from volcanoes". Transactions of the American Geophysical Union 72: 249–55. doi:10.1029/90EO10192.
- ↑ "Climate Change 2001: Working Group I: The Scientific Basis: figure 6-6". http://www.grida.no/climate/ipcc_tar/wg1/fig6-6.htm. Retrieved 1 May 2006.
- ↑ The present carbon cycle - Climate Change
- ↑ 23.0 23.1 IPCC; Solomon, S., D. Qin, M. Manning, Z. Chen, M. Marquis, K.B. Averyt, M. Tignor and H.L. Miller (eds.) (2007). "Chapter 7. Couplings Between Changes in the Climate System and Biogeochemistry". Climate Change 2007: The Physical Science Basis. Contribution of Working Group I to the Fourth Assessment Report of the Intergovernmental Panel on Climate Change. Cambridge, United Kingdom and New York, NY, USA: Cambridge University Press. ISBN 978-0-521-88009-1. http://www.ipcc.ch/pdf/assessment-report/ar4/wg1/ar4-wg1-chapter7.pdf. Retrieved 13 May 2008.
- ↑ AR4 WG2 SPM pp. 9,11
- ↑ H. Steinfeld, P. Gerber, T. Wassenaar, V. Castel, M. Rosales, C. de Haan (2006) Livestock’s long shadow. Environmental issues and options. FAO Livestock, Environment and Development (LEAD) Initiative.
- ↑ 26.0 26.1 Raupach, M.R. et al. (2007). "Global and regional drivers of accelerating CO2 emissions". Proc. Natl. Acad. Sci. U.S.A. 104 (24): 10288–93. doi:10.1073/pnas.0700609104. PMID 17519334. PMC 1876160. http://www.pnas.org/cgi/reprint/0700609104v1.pdf.
- ↑ U.S. Greenhouse Gas Inventory - U.S. Greenhouse Gas Inventory Reports|Climate Change - Greenhouse Gas Emissions|U.S. EPA
- ↑ Lerner & K. Lee Lerner, Brenda Wilmoth (2006). "Environmental issues: essential primary sources."". Thomson Gale. http://catalog.loc.gov/cgi-bin/Pwebrecon.cgi?v3=1&DB=local&CMD=010a+2006000857&CNT=10+records+per+page. Retrieved 11 September 2006.
- ↑ Template:Cite press release
- ↑ "Endangerment and Cause or Contribute Findings for Greenhouse Gases under the Clean Air Act". Climate Change - Regulatory Initiatives. United States Environmental Protection Agency. 7 December 2009. http://www.epa.gov/climatechange/endangerment.html. Retrieved 10 December 2009.
- ↑ Evans, Kimberly Masters (2005). "The greenhouse effect and climate change". The environment: a revolution in attitudes. Detroit: Thomson Gale. ISBN 0-7876-9082-1.
- ↑ "Stefan-Boltzmann Law", Britannica Online
- ↑ NASA EO Cloud fact sheet
- ↑ Flückiger, Jacqueline (2002). "High-resolution Holocene N2O ice core record and its relationship with CH4 and CO2". Global Biogeochemical Cycles 16: 1010. doi:10.1029/2001GB001417.
- ↑ Friederike Wagner, Bent Aaby and Henk Visscher (2002). "Rapid atmospheric CO2 changes associated with the 8,200-years-B.P. cooling event". Proc. Natl. Acad. Sci. U.S.A. 99 (19): 12011–4. doi:10.1073/pnas.182420699. PMID 12202744.
- ↑ Andreas Indermühle, Bernhard Stauffer, Thomas F. Stocker (1999). "Early Holocene Atmospheric CO2 Concentrations". Science 286 (5446): 1815. doi:10.1126/science.286.5446.1815a. "Early Holocene Atmospheric CO2 Concentrations". Science. http://www.sciencemag.org/cgi/content/full/286/5446/1815a. Retrieved 26 May 2005.
- ↑ H.J. Smith, M Wahlen and D. Mastroianni (1997). "The CO2 concentration of air trapped in GISP2 ice from the Last Glacial Maximum-Holocene transition". Geophysical Research Letters 24 (1): 1–4. doi:10.1029/96GL03700.
- ↑ "Monthly Average Carbon Dioxide Concentration, Mauna Loa Observatory" (PDF). Carbon Dioxide Information Analysis Center. 2005. http://cdiac.ornl.gov/trends/co2/graphics/mlo145e_thrudc04.pdf. Retrieved 14 December 2008.
- ↑ Dr. Pieter Tans (3 May 2008) "Annual CO2 mole fraction increase (ppm)" for 1959–2007 National Oceanic and Atmospheric Administration Earth System Research Laboratory, Global Monitoring Division (additional details; see also K.A. Masarie, P.P. Tans (1995). "Extension and integration of atmospheric carbon dioxide data into a globally consistent measurement record". J. Geophys. Research 100: 11593–610. doi:10.1029/95JD00859.
- ↑ Climate Change 2001: The Scientific Basis
- ↑ Current Greenhouse Gas Concentrations
- ↑ 42.0 42.1 World Bank (2010). World Development Report 2010: Development and Climate Change. The International Bank for Reconstruction and Development / The World Bank, 1818 H Street NW, Washington DC 20433. doi:10.1596/978-0-8213-7987-5. ISBN 9780821379875. http://go.worldbank.org/BKLQ9DSDU0. Retrieved 2010-04-06.
- ↑ Banuri, T. et al. (1996) (PDF). Equity and Social Considerations. In: Climate Change 1995: Economic and Social Dimensions of Climate Change. Contribution of Working Group III to the Second Assessment Report of the Intergovernmental Panel on Climate Change (J.P. Bruce et al. Eds.). This version: Printed by Cambridge University Press, Cambridge, U.K., and New York, N.Y., U.S.A.. PDF version: IPCC website. doi:10.2277/0521568544. ISBN 9780521568548. http://www.ipcc.ch/ipccreports/sar/wg_III/ipcc_sar_wg_III_full_report.pdf.
- ↑ 44.0 44.1 IEA (2007). World Energy Outlook 2007 Edition- China and India Insights. International Energy Agency (IEA), Head of Communication and Information Office, 9 rue de la Fédération, 75739 Paris Cedex 15, France. pp. 600. ISBN 9789264027305. http://www.iea.org/publications/free_new_Desc.asp?PUBS_ID=1927. Retrieved 2010-05-04.
- ↑ 45.0 45.1 Grubb, M. (July-September 2003). "The Economics of the Kyoto Protocol". World Economics 4 (3): 143–189. http://www.econ.cam.ac.uk/rstaff/grubb/publications/J36.pdf. Retrieved 2010-03-25.
- ↑ UNFCCC (19 November 2007). "Compilation and synthesis of fourth national communications. Executive summary. Note by the secretariat. Document code: FCCC/SBI/2007/INF.6". United Nations Office at Geneva, Switzerland. http://unfccc.int/documentation/documents/advanced_search/items/3594.php?rec=j&priref=600004368#beg. Retrieved 2010-05-17.
- ↑ PBL (October 16, 2009). "Industrialised countries will collectively meet 2010 Kyoto target". Netherlands Environmental Assessment Agency (PBL) website. http://www.pbl.nl/en/dossiers/COP13Bali/moreinfo/Industrialised-countries-will-collectively-meet-2010-Kyoto-target.html. Retrieved 2010-04-03.
- ↑ 48.0 48.1 48.2 Rogner, H.-H., D. Zhou, R. Bradley. P. Crabbé, O. Edenhofer, B.Hare, L. Kuijpers, M. Yamaguchi (2007). Executive Summary. In (book chapter): Introduction. In: Climate Change 2007: Mitigation. Contribution of Working Group III to the Fourth Assessment Report of the Intergovernmental Panel on Climate Change (B. Metz, O.R. Davidson, P.R. Bosch, R. Dave, L.A. Meyer (eds)). Print version: Cambridge University Press, Cambridge, United Kingdom and New York, NY, USA. This version: IPCC website. ISBN 9780521880114. http://www.ipcc.ch/publications_and_data/ar4/wg3/en/ch1s1-es.html. Retrieved 2010-05-05.
- ↑ PBL (25 June 2009). "Global CO2 emissions: annual increase halves in 2008". Netherlands Environmental Assessment Agency (PBL) website. http://www.pbl.nl/en/publications/2009/Global-CO2-emissions-annual-increase-halves-in-2008.html. Retrieved 2010-05-05.
- ↑ Carbon Trust (March 2009). "Global Carbon Mechanisms: Emerging lessons and implications (CTC748)". Carbon Trust website. http://www.carbontrust.co.uk/Publications/pages/publicationdetail.aspx?id=CTC748&respos=2&q=global+carbon+market&o=Rank&od=asc&pn=0&ps=10. Retrieved 2010-03-31.
- ↑ PBL (24 February 2010). "Dossier Climate Change: FAQs. Question 10: Which are the top-20 CO2 or GHG emitting countries?". Netherlands Environment Agency website. http://www.pbl.nl/en/dossiers/Climatechange/FAQs/index.html?vraag=10&title=Which%20are%20the%20top-20%20CO2%20or%20GHG%20emitting%20countries%3F#10. Retrieved 2010-05-01.
- ↑ MNP (2007). "Greenhouse gas emissions of countries in 2005 and ranking of their per capita emissions. Table 2.a. Top-20 countries of greenhouse emissions in 2006 from fossil fuels and cement production". Netherlands Environment Agency website. http://www.pbl.nl/images/Top20-CO2andGHG-countries-in2006-2005(GB)_tcm61-36276.xls. Retrieved 2010-05-01.
- ↑ Rogner, H.-H., D. Zhou, R. Bradley. P. Crabbé, O. Edenhofer, B.Hare, L. Kuijpers, M. Yamaguchi (2007). 1.3.1.2 Intensities. In (book chapter): Introduction. In: Climate Change 2007: Mitigation. Contribution of Working Group III to the Fourth Assessment Report of the Intergovernmental Panel on Climate Change (B. Metz, O.R. Davidson, P.R. Bosch, R. Dave, L.A. Meyer (eds)). Print version: Cambridge University Press, Cambridge, United Kingdom and New York, NY, USA. This version: IPCC website. ISBN 9780521880114. http://www.ipcc.ch/publications_and_data/ar4/wg3/en/ch1s1-3-1-2.html. Retrieved 2010-05-05.
- ↑ "Voluntary Reporting of Greenhouse Gases Program". Energy Information Administration. http://www.eia.doe.gov/oiaf/1605/coefficients.html. Retrieved 21 August 2009.
- ↑ http://www.grida.no/publications/other/ipcc%5Ftar/?src=/climate/ipcc_tar/wg1/218.htm
- ↑ 56.0 56.1 Jacob, Daniel (1999). Introduction to Atmospheric Chemistry. Princeton University Press. pp. 25–26. ISBN 0-691-00185-5. http://www-as.harvard.edu/people/faculty/djj/book/.
- ↑ IPCC Fourth Assessment Report, Table 2.14
- ↑ edited by Susan Solomon ... (2007). "Frequently Asked Question 7.1 "Are the Increases in Atmospheric Carbon Dioxide and Other Greenhouse Gases During the Industrial Era Caused by Human Activities?"". in Solomon, Susan; Qin, Dahe; Manning, Martin et al.. IPCC, 2007: Climate Change 2007: The Physical Science Basis. Contribution of Working Group I to the Fourth Assessment Report of the Intergovernmental Panel on Climate Change. Cambridge, United Kingdom and New York, NY, USA: Cambridge Press. ISBN 978-0521-88009-1. http://www.gcrio.org/ipcc/ar4/wg1/faq/ar4wg1faq-7-1.pdf. Retrieved 24 July 2007.
- ↑ Archer, David (2005). "Fate of fossil fuel CO2 in geologic time" (PDF). Journal of Geophysical Research 110 (C9): C09S05.1–C09S05.6. doi:10.1029/2004JC002625. http://geosci.uchicago.edu/~archer/reprints/archer.2005.fate_co2.pdf. Retrieved 27 July 2007.
- ↑ Caldeira, Ken; Wickett, Michael E. (2005). "Ocean model predictions of chemistry changes from carbon dioxide emissions to the atmosphere and ocean" (PDF). Journal of Geophysical Research 110 (C9): C09S04.1–12. doi:10.1029/2004JC002671. http://www.ipsl.jussieu.fr/~jomce/acidification/paper/Caldeira_Wickett_2005_JGR.pdf. Retrieved 27 July 2007.
- ↑ Use of ozone depleting substances in laboratories. TemaNord 2003:516
- ↑ Montreal Protocol
- ↑ 63.0 63.1 Canadell, J.G.; Le Quere, C.; Raupach, M.R.; Field, C.B.; Buitenhuis, E.T.; Ciais, P.; Conway, T.J.; Gillett, N.P.; Houghton, R.A.; Marland, G. (2007). "Contributions to accelerating atmospheric CO2 growth from economic activity, carbon intensity, and efficiency of natural sinks". Proc. Natl. Acad. Sci. U.S.A.. http://www.pnas.org/cgi/reprint/0702737104v1.pdf. Retrieved 15 March 2008.
- ↑ Obersteiner M, Azar C, Kauppi P, et al. (October 2001). "Managing climate risk". Science 294 (5543): 786–7. doi:10.1126/science.294.5543.786b. PMID 11681318.
- ↑ Azar, C., Lindgren, K., Larson, E.D. and Möllersten, K. (2006). "Carbon capture and storage from fossil fuels and biomass – Costs and potential role in stabilising the atmosphere". Climatic Change 74: 47–79. doi:10.1007/s10584-005-3484-7. http://www.environmental-expert.com/Files%5C6063%5Carticles%5C6220%5Cw30h4274h130580u.pdf.
- ↑ 66.0 66.1 66.2 "Geoengineering the climate: science, governance and uncertainty". The Royal Society. 2009. http://royalsociety.org/displaypagedoc.asp?id=35151. Retrieved 12 September 2009.
- ↑ Fischer, B.S., N. Nakicenovic, K. Alfsen, J. Corfee Morlot, F. de la Chesnaye, J.-Ch. Hourcade, K. Jiang, M. Kainuma, E. La Rovere, A. Matysek, A. Rana, K. Riahi, R. Richels, S. Rose, D. van Vuuren, R. Warren, (2007)“Issues related to mitigation in the long term context”, In Climate Change 2007: Mitigation. Contribution of Working Group III to the Fourth Assessment Report of the Inter-governmental Panel on Climate Change [B. Metz, O.R. Davidson, P.R. Bosch, R. Dave, L.A. Meyer (eds)], Cambridge University Press, Cambridge.
- ↑ Impact of Emissions, Chemistry, and Climate on Atmospheric Carbon Monoxide: 100-year Predictions from a Global Chemistry-Climate ModelPDF (115 KB)
- ↑ Shindell, Drew T. (2005). "An emissions-based view of climate forcing by methane and tropospheric ozone". Geophysical Research Letters 32: L04803. doi:10.1029/2004GL021900. http://www.nasa.gov/vision/earth/lookingatearth/methane.html.
- ↑ Methane's Impacts on Climate Change May Be Twice Previous Estimates
References[]
Template:Global warming Template:Use dmy dates
af:Kweekhuisgas
ar:غازات الدفيئة
be:Парніковы газ
bg:Парников газ
ca:Gas hivernacle
cs:Skleníkové plyny
da:Drivhusgas
de:Treibhausgas
et:Kasvuhoonegaasid
es:Gas de efecto invernadero
eu:Berotegi-efektuko gas
fa:انتشار کربن
fr:Gaz à effet de serre
gl:Gas de efecto invernadoiro
ko:온실 기체
hr:Staklenički plinovi
id:Gas rumah kaca
is:Gróðurhúsalofttegund
it:Gas serra
he:גז חממה
ka:სათბურის აირები
lv:Siltumnīcas gāze
lt:Šiltnamio dujos
hu:Üvegházhatású gázok
nl:Broeikasgassen
ja:温室効果ガス
no:Drivhusgass
nn:Drivhusgass
my:မှန်လုံအိမ်ဓာတ်ငွေ့
pl:Gaz cieplarniany
pt:Gases do efeito estufa
ru:Парниковый газ
simple:Greenhouse gas
sk:Skleníkový plyn
sl:Toplogredni plin
fi:Kasvihuonekaasu
ta:பைங்குடில் வாயு
te:గ్రీన్హౌస్ వాయువు
th:แก๊สเรือนกระจก
tr:Sera gazları
uk:Парниковий газ
vi:Khí nhà kính
zh-yue:溫室氣體
zh:温室气体
Cite error: <ref> tags exist for a group named "note", but no corresponding <references group="note"/> tag was found