
Nellis Solar Power Plant at Nellis Air Force Base in the USA. These panels track the sun in one axis.
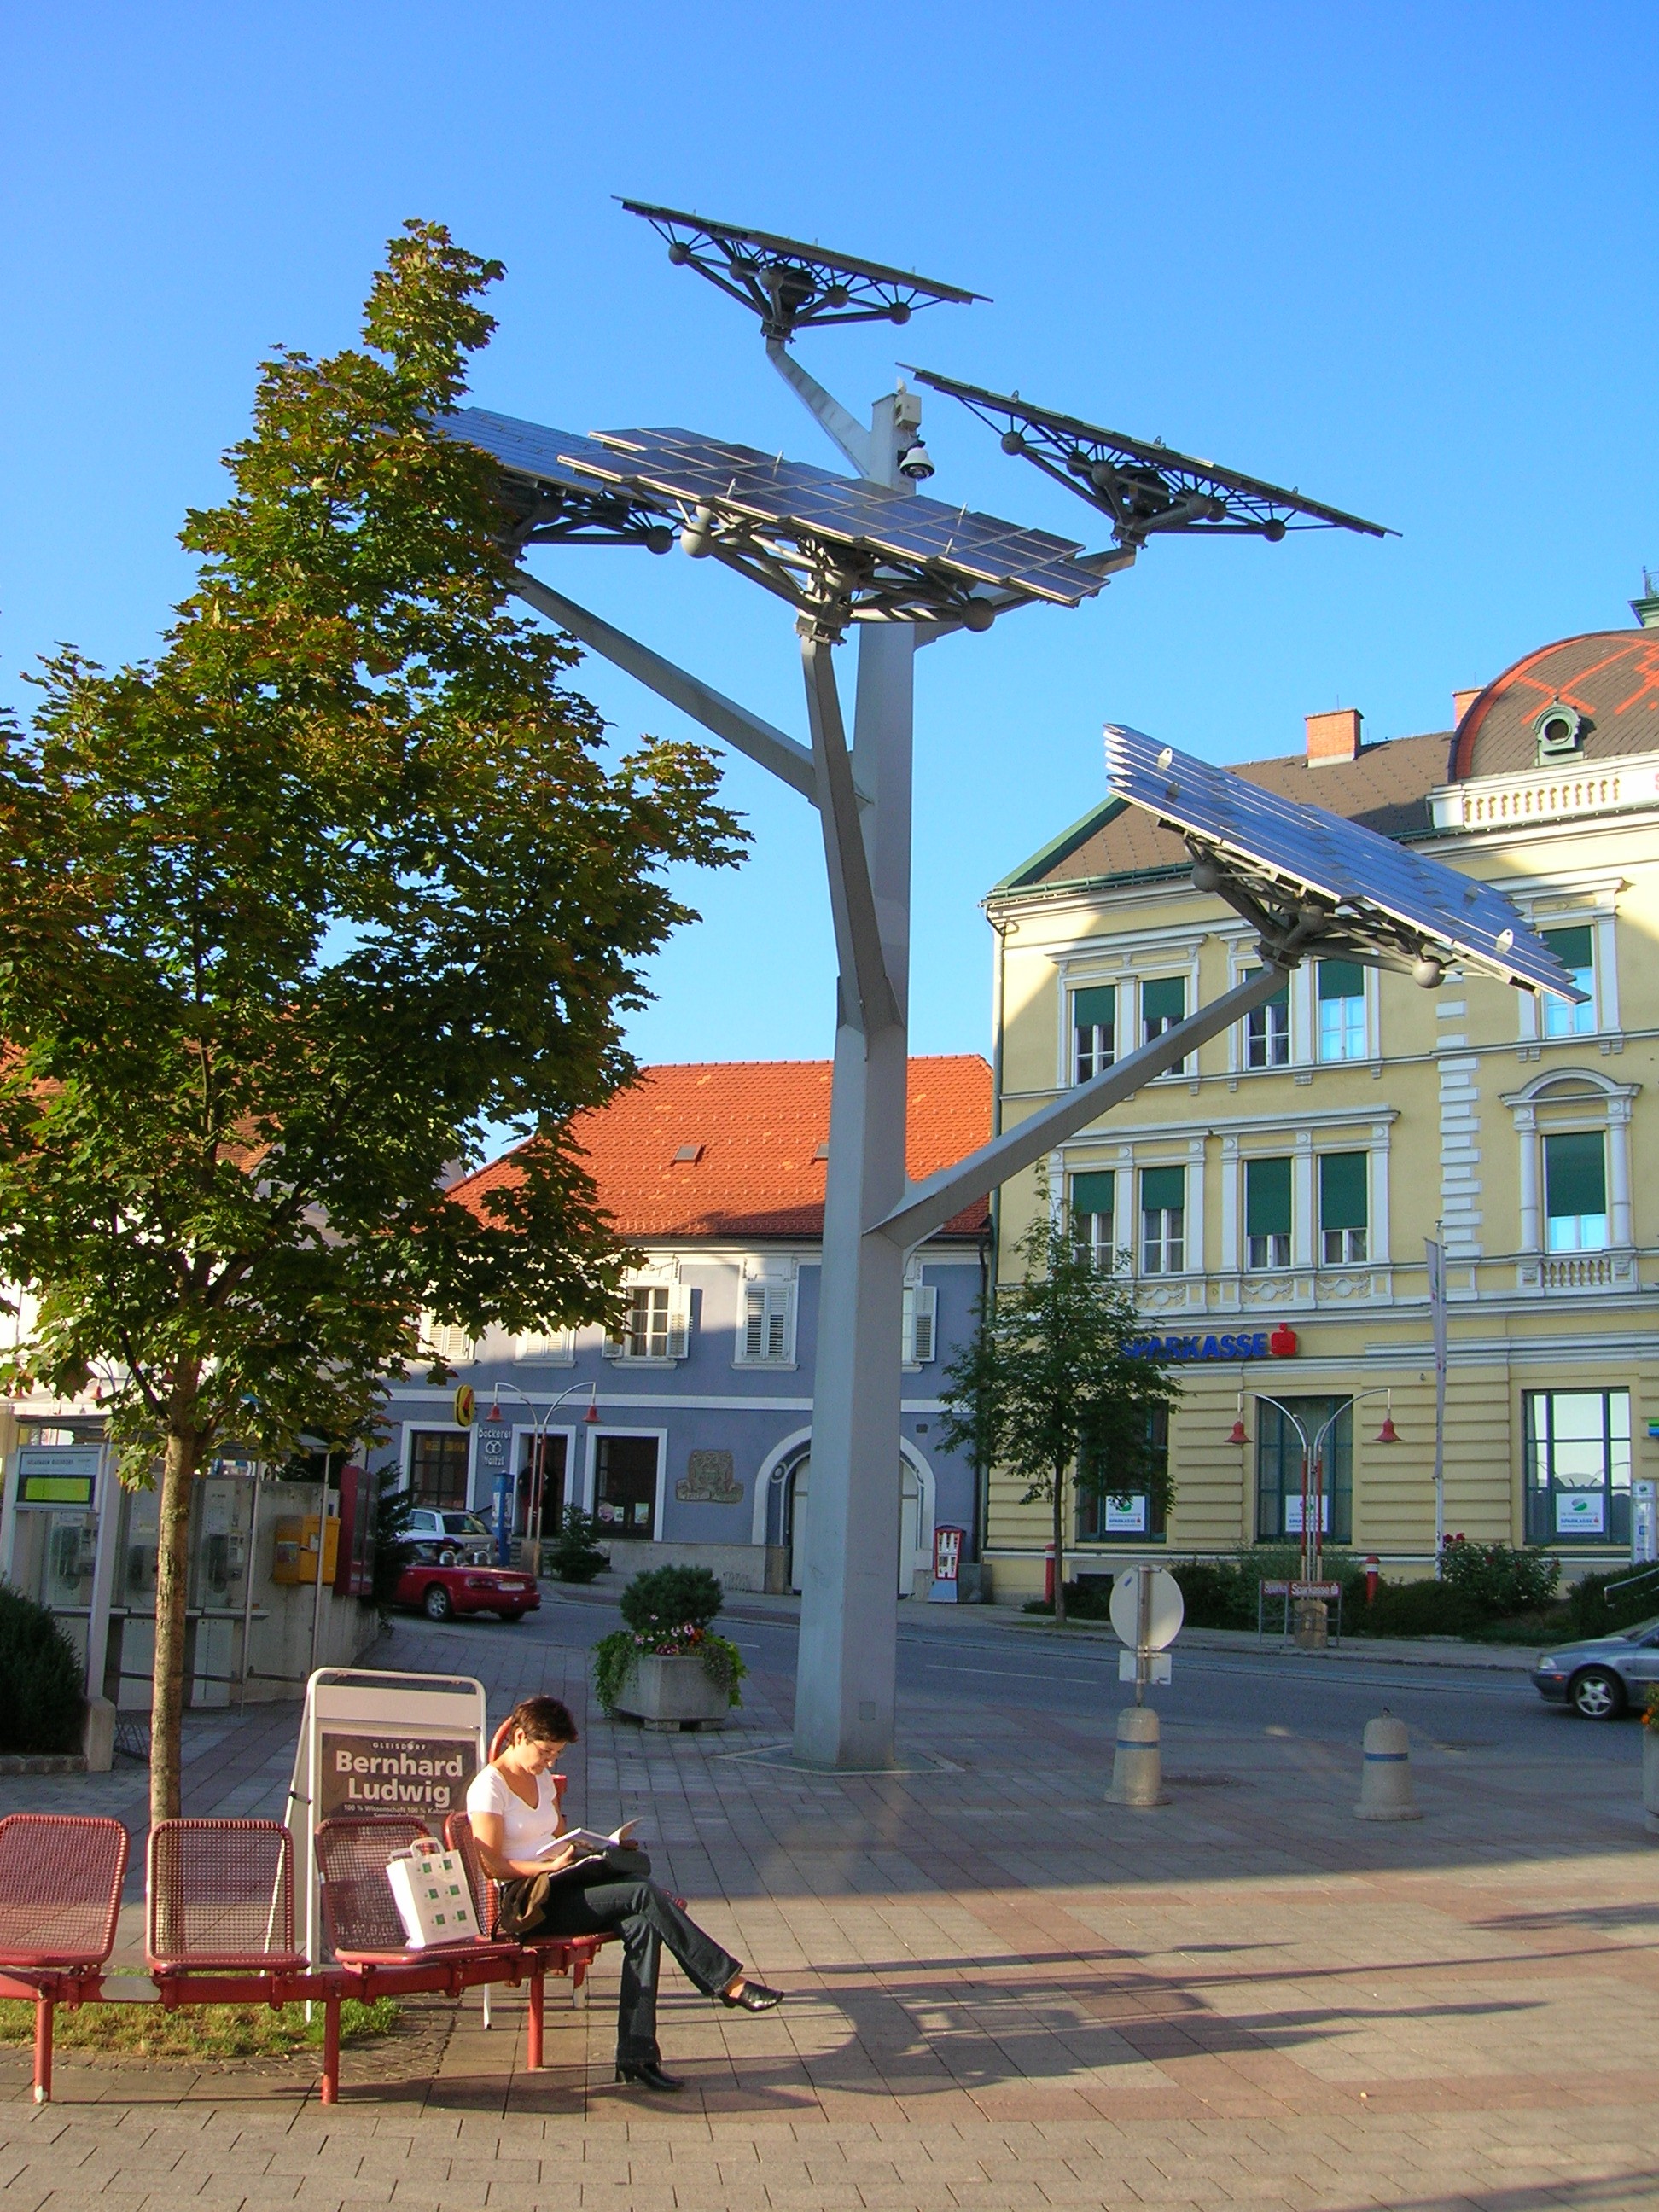
Photovoltaic system 'tree' in Styria, Austria
Photovoltaics (PVs) are arrays of cells containing a solar photovoltaic material that converts solar radiation into direct current electricity. Materials presently used for photovoltaics include monocrystalline silicon, polycrystalline silicon, amorphous silicon, cadmium telluride, and copper indium selenide/sulfide.[1] Due to the growing demand for renewable energy sources, the manufacture of solar cells and photovoltaic arrays has advanced dramatically in recent years.[2][3][4]
Photovoltaic production has been increasing by an average of more than 20 percent each year since 2002, making it the world’s fastest-growing energy technology.[5][6] At the end of 2009, the cumulative global PV installations surpassed 21,000 megawatts.[6][7] Germany installed a record 3,800 MW of solar PV in 2009.[8] Roughly 90% of this generating capacity consists of grid-tied electrical systems. Such installations may be ground-mounted (and sometimes integrated with farming and grazing) [9] or built into the roof or walls of a building, known as Building Integrated Photovoltaics or BIPV for short.[10] Solar PV power stations today have capacities ranging from 10-60 MW although proposed solar PV power stations will have a capacity of 150 MW or more.[1]
Driven by advances in technology and increases in manufacturing scale and sophistication, the cost of photovoltaics has declined steadily since the first solar cells were manufactured.[11] Net metering and financial incentives, such as preferential feed-in tariffs for solar-generated electricity, have supported solar PV installations in many countries.
Overview[]

Photovoltaic cells produce electricity directly from sunlight
Photovoltaics are best known as a method for generating electric power by using solar cells to convert energy from the sun into electricity. The photovoltaic effect refers to photons of light knocking electrons into a higher state of energy to create electricity. The term photovoltaic denotes the unbiased operating mode of a photodiode in which current through the device is entirely due to the transduced light energy. Virtually all photovoltaic devices are some type of photodiode.
Solar cells produce direct current electricity from sun light, which can be used to power equipment or to recharge a battery. The first practical application of photovoltaics was to power orbiting satellites and other spacecraft, but today the majority of photovoltaic modules are used for grid connected power generation. In this case an inverter is required to convert the DC to AC. There is a smaller market for off-grid power for remote dwellings, boats, recreational vehicles, electric cars, roadside emergency telephones, remote sensing, and cathodic protection of pipelines.

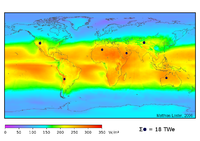
Average solar irradiance, watts per square metre. Note that this is for a horizontal surface, whereas solar panels are normally mounted at an angle and receive more energy per unit area. The small black dots show the area of solar panels needed to generate all of the world's energy using 8% efficient photovoltaics.
Cells require protection from the environment and are usually packaged tightly behind a glass sheet. When more power is required than a single cell can deliver, cells are electrically connected together to form photovoltaic modules, or solar panels. A single module is enough to power an emergency telephone, but for a house or a power plant the modules must be arranged in multiples as arrays. Although the selling price of modules is still too high to compete with grid electricity in most places, significant financial incentives in Japan and then Germany, Italy and France triggered a huge growth in demand, followed quickly by production. In 2008, Spain installed 45% of all photovoltaics, but a change in law limiting the feed-in tariff is expected to cause a precipitous drop in the rate of new installations there, from an extra 2500 MW in 2008 to an expected additional 375 MW in 2009.[12]
Perhaps not unexpectedly, a significant market has emerged in off-grid locations for solar-power-charged storage-battery based solutions. These often provide the only electricity available.[13] The first commercial installation of this kind was in 1966 on Ogami Island in Japan to transition Ogami Lighthouse from gas torch to fully self-sufficient electrical power.
World solar photovoltaic (PV) installations were 2.826 gigawatts peak (GWp) in 2007, and 5.95 gigawatts in 2008, a 110% increase.[14][15] The three leading countries (Germany, Japan and the US) represent nearly 89% of the total worldwide PV installed capacity. According to Navigant Consulting and Electronic Trend Publications, the estimated PV worldwide installations outlooks of 2012 are 18.8GW and 12.3GW respectively. Notably, the manufacture of solar cells and modules had expanded in recent years.
Germany installed a record 3,800 MW of solar PV in 2009; in contrast, the US installed about 500 MW in 2009. The previous record, 2,600 MW, was set by Spain in 2008. Germany was also the fastest growing major PV market in the world from 2006 to 2007Industry observers speculate that Germany could install more than 4,500 MW in 2009.[8][16] The German PV industry generates over 10,000 jobs in production, distribution and installation. By the end of 2006, nearly 88% of all solar PV installations in the EU were in grid-tied applications in Germany.[2] Photovoltaic power capacity is measured as maximum power output under standardized test conditions (STC) in "Wp" (Watts peak).[17] The actual power output at a particular point in time may be less than or greater than this standardized, or "rated," value, depending on geographical location, time of day, weather conditions, and other factors.[18] Solar photovoltaic array capacity factors are typically under 25%, which is lower than many other industrial sources of electricity.[19] Therefore the 2008 installed base peak output would have provided an average output of 3.04 GW (assuming 20% × 15,200 MWp). This represented 0.15 percent of global demand at the time.[20]
The EPIA/Greenpeace Advanced Scenario shows that by the year 2030, PV systems could be generating approximately 1,864 GW of electricity around the world. This means that, assuming a serious commitment is made to energy efficiency, enough solar power would be produced globally in twenty-five years’ time to satisfy the electricity needs of almost 14% of the world’s population.[21]
Current development[]


Map of solar electricity potential in Europe. Germany is the current leader in solar production.
Crystalline silicon modules were mainstream, but now are thin-film solar cells (CdTe[22] CIGS,[23] amorphous Si,[24] microcrystalline Si). Other developments include casting wafers instead of sawing,[25] , concentrator modules, 'Sliver' cells, and continuous printing processes. Due to economies of scale solar panels get less costly as people use and buy more — as manufacturers increase production to meet demand, the cost and price is expected to drop in the years to come. By early 2006, the average cost per installed watt for a residential sized system was about USD 7.50 to USD 9.50, including panels, inverters, mounts, and electrical items.[26]
In 2006 investors began offering free solar panel installation in return for a 25 year contract, or Power Purchase Agreement, to purchase electricity at a fixed price, normally set at or below current electric rates.[27][28] It is expected that by 2009 over 90% of commercial photovoltaics installed in the United States will be installed using a power purchase agreement.[29] An innovative financing arrangement is being tested in Berkeley, California, which adds an amount to the property assessment to allow the city to pay for the installed panels up front, which the homeowner pays for over a 20 year period at a rate equal to the annual electric bill savings, thus allowing free installation for the homeowner at no cost to the city.[30]
The current market leader in solar panel efficiency (measured by energy conversion ratio) is SunPower, a San Jose based company. Sunpower's cells have a conversion ratio of 24.2%, well above the market average of 12-18%.[31] However, advances past this efficiency mark are being pursued in academia and R&D labs with efficiencies of 42% achieved at the University of Delaware in conjunction with DuPont by means of concentration of light[32] The highest efficiencies achieved without concentration include Sharp Corporation at 35.8% using a proprietary triple-junction manufacturing technology in 2009,[33] and Boeing Spectrolab (40.7% also using a triple layer design). A March 2010 experimental demonstration of a design by a Caltech group which has an absorption efficiency of 85% in sunlight and 95% at certain wavelengths (it is claimed to have near perfect quantum efficiency).[34] However, absorption efficiency should not be confused with the sunlight-to-electricity conversion efficiency.
Applications[]
Power stations[]


President Barack Obama speaks at the DeSoto Next Generation Solar Energy Center.
- Main article: List of photovoltaic power stations
As of October 2009, the largest photovoltaic (PV) power plants in the world are the Olmedilla Photovoltaic Park (Spain, 60 MW), the Strasskirchen Solar Park (Germany, 54 MW), the Lieberose Photovoltaic Park (Germany, 53 MW), the Puertollano Photovoltaic Park (Spain, 50 MW), the Moura photovoltaic power station (Portugal, 46 MW), and the Waldpolenz Solar Park (Germany, 40 MW).[35]
As of October 2009, the largest photovoltaic power plant in North America is the 25 MW DeSoto Next Generation Solar Energy Center in Florida. The plant consists of over 90,000 solar panels.[36]
| Name of PV power plant | Country | Nominal Power (MWp) |
GW·h /year |
Capacity factor |
Notes |
|---|---|---|---|---|---|
| Olmedilla Photovoltaic Park | Spain | 55[37] | 85[35] | 0.16 | Siliken crystalline silicon modules. Completed September 2008 |
| Strasskirchen Solar Park | Germany | 54 | |||
| Lieberose Photovoltaic Park [38][39] | Germany | 53 | 53[39] | 0.11 | 700'000 First Solar CdTe modules, opened 2009[40] |
| Puertollano Photovoltaic Park | Spain | 47.6 | 231'653 crystalline silicon modules, Suntech and Solaria, opened 2008 | ||
| Moura photovoltaic power station[41] | Portugal | 46 | 93[41] | 0.23 | Completed December 2008 |
| Kothen Solar Park | Germany | 45 | 2009 | ||
| Finsterwalde Solar Park | Germany | 41 | 2009 | ||
| Waldpolenz Solar Park[42][43] | Germany | 40 | 40[43] | 0.11 | 550,000 First Solar thin-film CdTe modules. Completed December 2008 |
Topaz Solar Farm is a proposed 550 MW solar photovoltaic power plant which is to be built northwest of California Valley in the US at a cost of over $1 billion.[44] Built on Template:Convert/mi2 of ranchland,[45] the project would utilize thin-film PV panels designed and manufactured by OptiSolar in Hayward and Sacramento. The project would deliver approximately 1,100 gigawatt-hours (GW·h) annually of renewable energy. The project is expected to begin construction in 2010,[45] begin power delivery in 2011, and be fully operational by 2013.[46]
High Plains Ranch is a proposed 250 MW solar photovoltaic power plant which is to be built by SunPower in the Carrizo Plain, northwest of California Valley.[46]
In buildings[]
Photovoltaic arrays are often associated with buildings: either integrated into them, mounted on them or mounted nearby on the ground.
Arrays are most often retrofitted into existing buildings, usually mounted on top of the existing roof structure or on the existing walls. Alternatively, an array can be located separately from the building but connected by cable to supply power for the building. In 2010, more than four-fifths of the 9,000 MW of solar PV operating in Germany was installed on rooftops.[8]

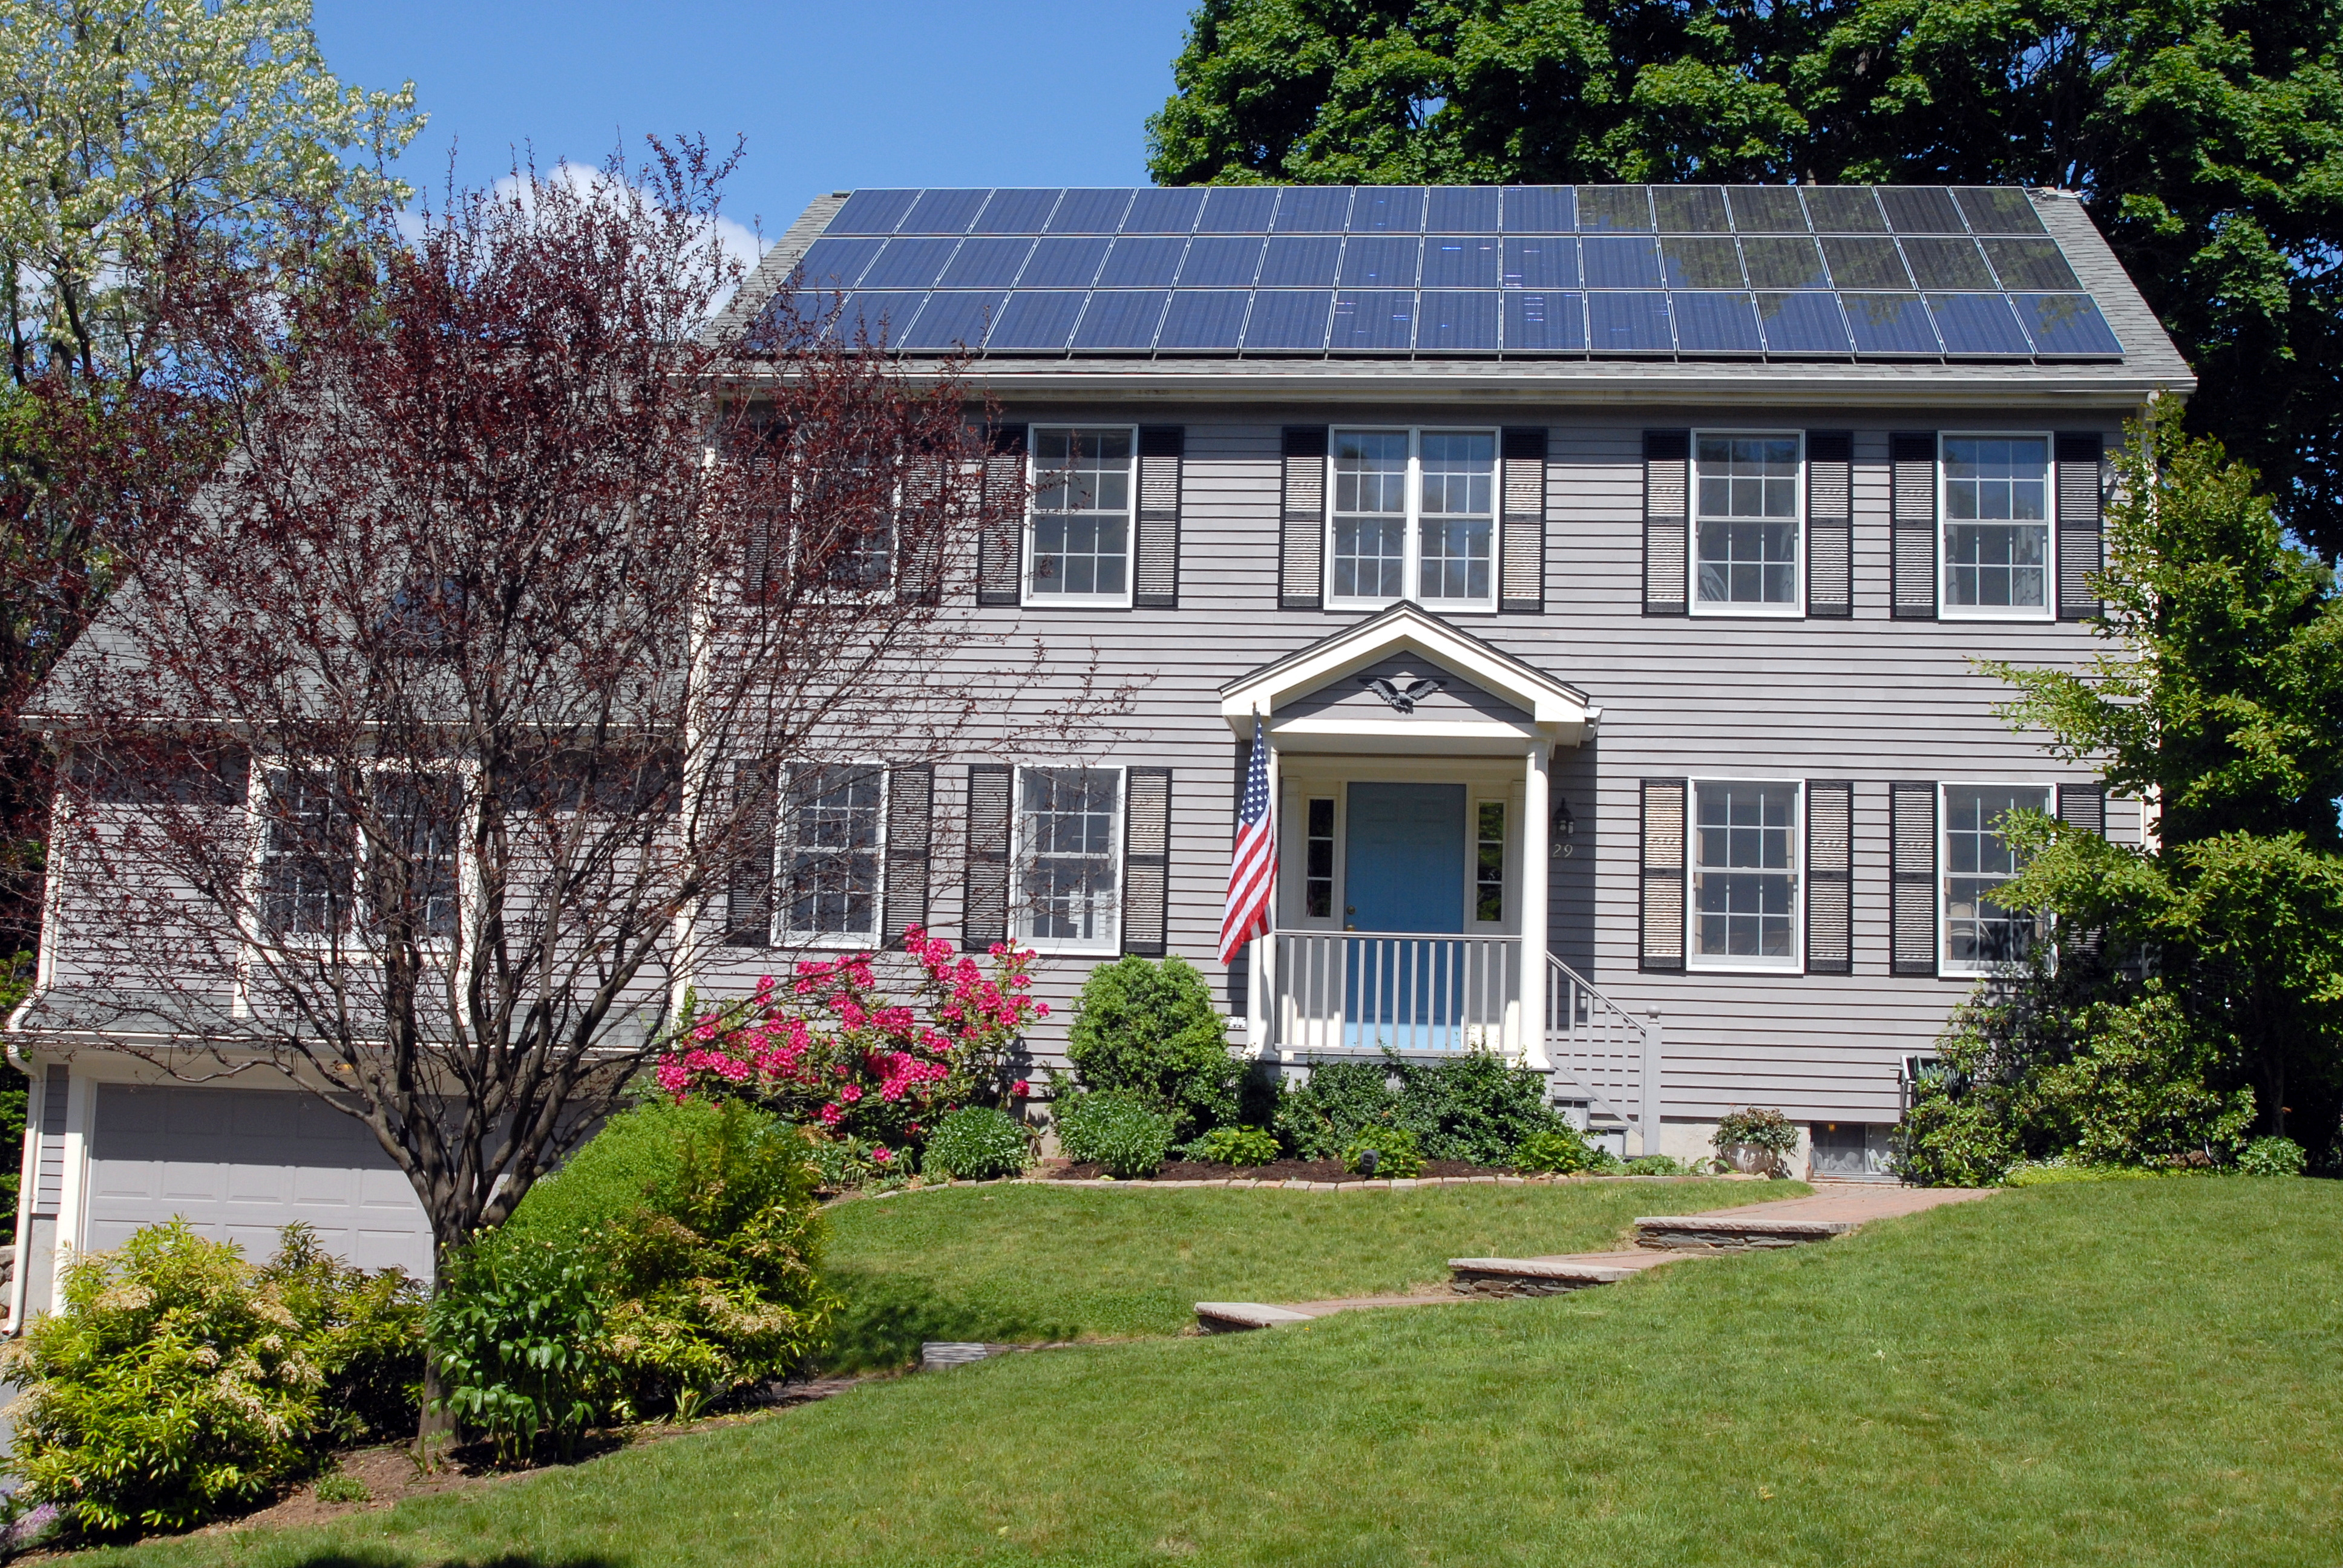
Photovoltaic solar panels on a house roof.
Building-integrated photovoltaics (BIPV) are increasingly incorporated into new domestic and industrial buildings as a principal or ancillary source of electrical power.[47] Typically, an array is incorporated into the roof or walls of a building. Roof tiles with integrated PV cells are also common.
The power output of photovoltaic systems for installation in buildings is usually described in kilowatt-peak units (kWp).
In transport[]
- Main article: Photovoltaics in transport
PV has traditionally been used for auxiliary power in space. PV is rarely used to provide motive power in transport applications, but is being used increasingly to provide auxiliary power in boats and cars. Recent advances in solar race cars, however, have produced cars that with little changes could be used for transportation.[48]
Standalone devices[]


Solar parking meter.
Until a decade or so ago, PV was used frequently to power calculators and novelty devices. Improvements in integrated circuits and low power LCD displays make it possible to power such devices for several years between battery changes, making PV use less common. In contrast, solar powered remote fixed devices have seen increasing use recently in locations where significant connection cost makes grid power prohibitively expensive. Such applications include water pumps,[49] parking meters,[50] emergency telephones,[51] trash compactors,[52] temporary traffic signs, and remote guard posts & signals.
Rural electrification[]
Developing countries where many villages are often more than five kilometers away from grid power have begun using photovoltaics. In remote locations in India a rural lighting program has been providing solar powered LED lighting to replace kerosene lamps. The solar powered lamps were sold at about the cost of a few month's supply of kerosene.[53][54] Cuba is working to provide solar power for areas that are off grid.[55] These are areas where the social costs and benefits offer an excellent case for going solar though the lack of profitability could relegate such endeavors to humanitarian goals.
Solar roadways[]
- Main article: Solar roadway
A 45 mi (72 km) section of roadway in Idaho is being used to test the possibility of installing solar panels into the road surface, as roads are generally unobstructed to the sun and represent about the percentage of land area needed to replace other energy sources with solar power.[56]
Solar Power satellites[]
- Main article: Solar power satellite
Design studies of large solar power collection satellites have been conducted for decades. The idea was first proposed by Peter Glaser, then of Arthur D. Little Inc; NASA conducted a long series of engineering and economic feasibility studies in the 1970s, and interest has revived in first years of the 21st century.
From a practical economic viewpoint, the key issue for such satellites appears to be the launch cost. Additional considerations will include developing space based assembly techniques, but they seem to be less a hurdle than the capital cost. These will be reduced as photovoltaic cell costs are reduced or alternatively efficiency increased.
Performance[]
Temperature[]
Generally, temperatures above room temperature reduce the performance of photovoltaics.[57]
Optimum Orientation of Solar Panels[]
For best performance, terrestrial PV systems aim to maximize the time they face the sun. Solar trackers aim to achieve this by moving PV panels to follow the sun. The increase can be by as much as 20% in winter and by as much as 50% in summer. Static mounted systems can be optimized by analysis of the Sun path. Panels are often set to latitude tilt, an angle equal to the latitude, but performance can be improved by adjusting the angle for summer or winter.
Economics[]
Template:Off-topic
| This section may contain original research. Please improve it by verifying the claims made and adding references. Statements consisting only of original research may be removed. More details may be available on the talk page. (September 2007) |


US average daily solar energy insolation received by a latitude tilt photovoltaic cell.
In photovoltaics, the solar value added chain is the set of steps from sand or raw silicon to the completed solar module and photovoltaic system completion and installation.[58]
Energy payback time and energy returned on energy invested[]
The energy payback time of a power generating system is the time required to generate as much energy as was consumed during production of the system. In 2000 the energy payback time of PV systems was estimated as 8 to 11 years[59] and in 2006 this was estimated to be 1.5 to 3.5 years for crystalline silicon PV systems[60] and 1-1.5 years for thin film technologies (S.Europe).[60]
Another economic measure, closely related to the energy payback time, is the energy returned on energy invested (EROEI) which is the ratio of electricity generated divided by the energy required to build and maintain the equipment. (This is not the same as the economic return on investment (EROI), which varies according to local energy prices, subsidies available and metering techniques.) With lifetimes of at least 30 years[citation needed], the EROEI of PV systems are in the range of 10 to 30, thus generating enough energy over their lifetimes to reproduce themselves many times (6-31 reproductions) depending on what type of material, balance of system (BOS), and the geographic location of the system.[61]
Power costs[]
The PV industry is beginning to adopt levelized cost of energy (LCOE) as the unit of cost. For a 10 MW plant in Phoenix, AZ, the LCOE is estimated at $0.15 to 0.22/kWh in 2005.[62]
The table below is a pure mathematical calculation. It illustrates the calculated total cost in US cents per kilowatt-hour of electricity generated by a photovoltaic system as function of the investment cost and the efficiency, assuming some accounting parameters such as cost of capital and depreciation period. The row headings on the left show the total cost, per peak kilowatt (kWp), of a photovoltaic installation. The column headings across the top refer to the annual energy output in kilowatt-hours expected from each installed peak kilowatt. This varies by geographic region because the average insolation depends on the average cloudiness and the thickness of atmosphere traversed by the sunlight. It also depends on the path of the sun relative to the panel and the horizon.
Panels can be mounted at an angle based on latitude,[63] or solar tracking can be utilized to access even more perpendicular sunlight, thereby raising the total energy output. The calculated values in the table reflect the total cost in cents per kilowatt-hour produced. They assume a 10% total capital cost (for instance 4% interest rate, 1% operating and maintenance cost, and depreciation of the capital outlay over 20 years).
| Insolation | |||||||||
|---|---|---|---|---|---|---|---|---|---|
| Cost | 2400 kWh/kWp•y |
2200 kWh/kWp•y |
2000 kWh/kWp•y |
1800 kWh/kWp•y |
1600 kWh/kWp•y |
1400 kWh/kWp•y |
1200 kWh/kWp•y |
1000 kWh/kWp•y |
800 kWh/kWp•y |
| 200 $/kWp | 0.8 | 0.9 | 1.0 | 1.1 | 1.3 | 1.4 | 1.7 | 2.0 | 2.5 |
| 600 $/kWp | 2.5 | 2.7 | 3.0 | 3.3 | 3.8 | 4.3 | 5.0 | 6.0 | 7.5 |
| 1000 $/kWp | 4.2 | 4.5 | 5.0 | 5.6 | 6.3 | 7.1 | 8.3 | 10.0 | 12.5 |
| 1400 $/kWp | 5.8 | 6.4 | 7.0 | 7.8 | 8.8 | 10.0 | 11.7 | 14.0 | 17.5 |
| 1800 $/kWp | 7.5 | 8.2 | 9.0 | 10.0 | 11.3 | 12.9 | 15.0 | 18.0 | 22.5 |
| 2200 $/kWp | 9.2 | 10.0 | 11.0 | 12.2 | 13.8 | 15.7 | 18.3 | 22.0 | 27.5 |
| 2600 $/kWp | 10.8 | 11.8 | 13.0 | 14.4 | 16.3 | 18.6 | 21.7 | 26.0 | 32.5 |
| 3000 $/kWp | 12.5 | 13.6 | 15.0 | 16.7 | 18.8 | 21.4 | 25.0 | 30.0 | 37.5 |
| 3400 $/kWp | 14.2 | 15.5 | 17.0 | 18.9 | 21.3 | 24.3 | 28.3 | 34.0 | 42.5 |
| 3800 $/kWp | 15.8 | 17.3 | 19.0 | 21.1 | 23.8 | 27.1 | 31.7 | 38.0 | 47.5 |
| 4200 $/kWp | 17.5 | 19.1 | 21.0 | 23.3 | 26.3 | 30.0 | 35.0 | 42.0 | 52.5 |
| 4600 $/kWp | 19.2 | 20.9 | 23.0 | 25.6 | 28.8 | 32.9 | 38.3 | 46.0 | 57.5 |
| 5000 $/kWp | 20.8 | 22.7 | 25.0 | 27.8 | 31.3 | 35.7 | 41.7 | 50.0 | 62.5 |
Physicists have claimed that recent technological developments bring the cost of solar energy more in parity with that of fossil fuels. In 2007, David Faiman, the director of the Ben-Gurion National Solar Energy Center of Israel, announced that the Center had entered into a project with Zenith Solar to create a home solar energy system that uses a 10 square meter reflector dish.[64] In testing, the concentrated solar technology proved to be up to five times more cost effective than standard flat photovoltaic silicon panels, which would make it almost the same cost as oil and natural gas.[65] A prototype ready for commercialization achieved a concentration of solar energy that was more than 1,000 times greater than standard flat panels.[66]
Grid parity[]
Grid parity, the point at which photovoltaic electricity is equal to or cheaper than grid power, is achieved first in areas with abundant sun and high costs for electricity such as in California and Japan.[67]
Grid parity has been reached in Hawaii and other islands that otherwise use fossil fuel (diesel fuel) to produce electricity, and most of the US is expected to reach grid parity by 2015.[68][69]
General Electric's Chief Engineer predicts grid parity without subsidies in sunny parts of the United States by around 2015. Other companies predict an earlier date:[70] the cost of solar power will be below grid parity for more than half of residential customers and 10% of commercial customers in the OECD, as long as grid electricity prices do not decrease through 2010.[71]
The fully loaded cost (cost not price) of solar electricity is $0.25/kWh or less in most of the OECD countries. By late 2011, the fully loaded cost is likely to fall below $0.15/kWh for most of the OECD and reach $0.10/kWh in sunnier regions. These cost levels are driving three emerging trends:[71]
- vertical integration of the supply chain;
- origination of power purchase agreements (PPAs) by solar power companies;
- unexpected risk for traditional power generation companies, grid operators and wind turbine manufacturers.
Abengoa Solar has announced the award of two R&D projects in the field of Concentrating Solar Power (CSP) by the US Department of Energy that total over $14 million. The goal of the DOE R&D program, working in collaboration with partners such as Abengoa Solar, is to develop CSP technologies that are competitive with conventional energy sources (grid parity) by 2015.[72] Concentrating photovoltaics (CPV) could reach grid parity in 2011.Template:Cn
Due to the growing demand for photovoltaic electricity, more companies enter into this market and lower cost of the photovoltaic electricity would be expected.
Net metering[]
- Main article: Net metering
Net metering is particularly important because it can be done with no changes to standard electricity meters (other than safety reasons since very old meters can overheat or fail when driven backwards)[citation needed], which accurately measure power in both directions and automatically report the difference, and because it allows homeowners and businesses to generate electricity at a different time from consumption, effectively using the grid as a giant storage battery. As more photovoltaics are used ultimately additional transmission and storage will need to be provided, normally in the form of pumped hydro-storage. Normally with net metering, deficits are billed each month while surpluses are rolled over to the following month and paid annually.
Financial incentives[]
- Main article: PV financial incentives
The political purpose of incentive policies for PV is to facilitate an initial small-scale deployment to begin to grow the industry, even where the cost of PV is significantly above grid parity, to allow the industry to achieve the economies of scale necessary to reach grid parity. The policies are implemented to promote national energy independence, high tech job creation and reduction of CO2 emissions.
Three incentive mechanisms are used (often in combination):
- investment subsidies: the authorities refund part of the cost of installation of the system,
- Feed-in Tariffs (FIT): the electricity utility buys PV electricity from the producer under a multiyear contract at a guaranteed rate.
- Solar Renewable Energy Certificates ("SRECs")
Rebates
With investment subsidies, the financial burden falls upon the taxpayer, while with feed-in tariffs the extra cost is distributed across the utilities' customer bases. While the investment subsidy may be simpler to administer, the main argument in favour of feed-in tariffs is the encouragement of quality. Investment subsidies are paid out as a function of the nameplate capacity of the installed system and are independent of its actual power yield over time, thus rewarding the overstatement of power and tolerating poor durability and maintenance. Some electric companies offer rebates to their customers, such as Austin Energy in Texas, which offers $2.50/watt installed up to $15,000.[73]
Feed-in Tariffs (FiT)
With feed-in tariffs, the financial burden falls upon the consumer. They reward the number of kilowatt-hours produced over a long period of time, but because the rate is set by the authorities, it may result in perceived overpayment. The price paid per kilowatt-hour under a feed-in tariff exceeds the price of grid electricity. Net metering refers to the case where the price paid by the utility is the same as the price charged.
Solar Renewable Energy Credits (SRECs)
Alternatively, SRECs allow for a market mechanism to set the price of the solar generated electricity subsity. In this mechanism, a renewable energy production or consumption target is set, and the utility (more technically the Load Serving Entity) is obliged to purchase renewable energy or face a fine (Alternative Compliance Payment or ACP). The producer is credited for an SREC for every 1,000 kWh of electricity produced. If the utility buys this SREC and retires it, they avoid paying the ACP. In principle this system delivers the cheapest renewable energy, since the all solar facilities are eligible and can be installed in the most economic locations. Uncertainties about the future value of SRECs have led to long-term SREC contract markets to give clarity to their prices and allow solar developers to pre-sell/hedge their SRECs.
Financial incentives for photovoltaics differ across countries and even across states within the US, including Australia, China,[74] Germany,[2] Israel,[75] Japan, and the United States
The Japanese government through its Ministry of International Trade and Industry ran a successful programme of subsidies from 1994 to 2003. By the end of 2004, Japan led the world in installed PV capacity with over 1.1 GW.[76]
In 2004, the German government introduced the first large-scale feed-in tariff system, under a law known as the 'EEG' (Erneuerbare Energien Gesetz) which resulted in explosive growth of PV installations in Germany. At the outset the FIT was over 3x the retail price or 8x the industrial price. The principle behind the German system is a 20 year flat rate contract. The value of new contracts is programmed to decrease each year, in order to encourage the industry to pass on lower costs to the end users. The programme has been more successful than expected with over 1GW installed in 2006, and political pressure is mounting to decrease the tariff to lessen the future burden on consumers.
Subsequently Spain, Italy, Greece (who enjoyed an early success with domestic solar-thermal installations for hot water needs) and France introduced feed-in tariffs. None have replicated the programmed decrease of FIT in new contracts though, making the German incentive relatively less and less attractive compared to other countries. The French and Greek FIT offer a high premium (EUR 0.55/kWh) for building integrated systems. California, Greece, France and Italy have 30-50% more insolation than Germany making them financially more attractive. The Greek domestic "solar roof" programme (adopted in June 2009 for installations up to 10 kW) has internal rates of return of 10-15% at current commercial installation costs, which, furthermore, is tax free.
In 2006 California approved the 'California Solar Initiative', offering a choice of investment subsidies or FIT for small and medium systems and a FIT for large systems. The small-system FIT of $0.39 per kWh (far less than EU countries) expires in just 5 years, and the alternate "EPBB" residential investment incentive is modest, averaging perhaps 20% of cost. All California incentives are scheduled to decrease in the future depending as a function of the amount of PV capacity installed.
At the end of 2006, the Ontario Power Authority (OPA, Canada) began its Standard Offer Program (SOP), the first in North America for small renewable projects (10MW or less). This guarantees a fixed price of $0.42 CDN per kWh over a period of twenty years. Unlike net metering, all the electricity produced is sold to the OPA at the SOP rate. The generator then purchases any needed electricity at the current prevailing rate (e.g., $0.055 per kWh). The difference should cover all the costs of installation and operation over the life of the contract. On October 1, 2009, OPA issued a Feed-in Tariff (FIT) program, increasing this fixed price to $0.802 per kWh.[77]
The price per kilowatt hour or per peak kilowatt of the FIT or investment subsidies is only one of three factors that stimulate the installation of PV. The other two factors are insolation (the more sunshine, the less capital is needed for a given power output) and administrative ease of obtaining permits and contracts.
Unfortunately the complexity of approvals in California, Spain and Italy has prevented comparable growth to Germany even though the return on investment is better.
In some countries, additional incentives are offered for BIPV compared to stand alone PV.
- France + EUR 0.16 /kWh (compared to semi-integrated) or + EUR 0.27/kWh (compared to stand alone)
- Italy + EUR 0.04-0.09 kWh
- Germany + EUR 0.05/kWh (facades only)
Investment[]
There is an International Conference on Solar Photovoltaic Investments organized by EPIA.[78]
Environmental impacts[]
Template:Off-topic Unlike fossil fuel based technologies, solar power does not lead to any harmful emissions during operation, but the production of the panels leads to some amount of pollution.
Greenhouse gases[]
Life cycle greenhouse gas emissions are now in the range of 25-32 g/kWh and this could decrease to 15 g/kWh in the future.[60] For comparison (of weighted averages), a combined cycle gas-fired power plant emits some 400-599 g/kWh,[79] an oil-fired power plant 893 g/kWh,[79] a coal-fired power plant 915-994 g/kWh[80] or with carbon capture and storage some 200 g/kWh, and a geothermal high-temp. power plant 91-122 g/kWh.[79] Only wind and geothermal low-temp. are better, emitting 11 g/kWh and 0-1 g/kWh[79] on average. Including the energy needed to mine uranium and the energy-intensity of power plant construction and decommissioning, some place nuclear power plants' life-cycle greenhouse gas emissions below 40 g/kWh, but others give much higher figures.[81] Using renewable energy sources in manufacturing and transportation would further drop carbon emissions. BP Solar owns two factories built by Solarex (one in Maryland, the other in Virginia) in which all of the energy used to manufacture solar panels is produced by solar panels. A 1-kilowatt system eliminates the burning of approximately 170 pounds of coal, 300 pounds of carbon dioxide from being released into the atmosphere, and saves up to 105 gallons of water consumption monthly.[82]
Cadmium[]
One issue that has often raised concerns is the use of cadmium in cadmium telluride solar cells (CdTe is only used in a few types of PV panels). Cadmium in its metallic form is a toxic substance that has the tendency to accumulate in ecological food chains. The amount of cadmium used in thin-film PV modules is relatively small (5-10 g/m²) and with proper emission control techniques in place the cadmium emissions from module production can be almost zero. Current PV technologies lead to cadmium emissions of 0.3-0.9 microgram/kWh over the whole life-cycle.[60] Most of these emissions actually arise through the use of coal power for the manufacturing of the modules, and coal and lignite combustion leads to much higher emissions of cadmium. Life-cycle cadmium emissions from coal is 3.1 microgram/kWh, lignite 6.2, and natural gas 0.2 microgram/kWh.
Note that if electricity produced by photovoltaic panels were used to manufacture the modules instead of electricity from burning coal, cadmium emissions from coal power usage in the manufacturing process could be entirely eliminated.
Advantages[]
The 89 petawatts of sunlight reaching the Earth's surface is plentiful - almost 6,000 times more than the 15 terawatts of average electrical power consumed by humans.[83] Additionally, solar electric generation has the highest power density (global mean of 170 W/m²)[citation needed] among renewable energies.[83]
Solar power is pollution-free during use. Production end-wastes and emissions are manageable using existing pollution controls. End-of-use recycling technologies are under development.[84]
PV installations can operate for many years with little maintenance or intervention after their initial set-up, so after the initial capital cost of building any solar power plant, operating costs are extremely low compared to existing power technologies.
Solar electric generation is economically superior where grid connection or fuel transport is difficult, costly or impossible. Long-standing examples include satellites, island communities, remote locations and ocean vessels.
When grid-connected, solar electric generation replaces some or all of the highest-cost electricity used during times of peak demand (in most climatic regions). This can reduce grid loading, and can eliminate the need for local battery power to provide for use in times of darkness. These features are enabled by net metering. Time-of-use net metering can be highly favorable, but requires newer electronic metering, which may still be impractical for some users.
Grid-connected solar electricity can be used locally thus reducing transmission/distribution losses (transmission losses in the US were approximately 7.2% in 1995).[85]
Compared to fossil and nuclear energy sources, very little research money has been invested in the development of solar cells, so there is considerable room for improvement. Nevertheless, experimental high efficiency solar cells already have efficiencies of over 40% in case of concentrating photovoltaic cells [86] and efficiencies are rapidly rising while mass-production costs are rapidly falling.[87]
Disadvantages[]
Photovoltaics are costly to install. While the modules are often warranted for upwards of 20 years, much of the investment in a home-mounted system may be lost if the home-owner moves and the buyer puts less value on the system than the seller. The city of Berkeley has come up with an innovative financing method to remove this limitation, by adding a tax assessment that is transferred with the home to pay for the solar panels.[88] Nine U.S. states have duplicated this solution.
Solar electricity is seen to be expensive. Once a PV system is installed it will produce electricity for no further cost until the inverter needs replacing. Current utility rates have increased every year for the past 20 years[citation needed] and with the increasing pressure on carbon reduction the rate will increase more aggressively.[89] This increase will (in the long run) easily offset the increased cost at installation but the timetable for payback is too long for most.
Solar electricity is not available at night and is less available in cloudy weather conditions from conventional photovoltaic technologies. Therefore, a storage or complementary power system is required. This is why many buildings with photovoltaic arrays are tied into the power grid; the grid absorbs excess electricity generated throughout the day, and provides electricity in the evening.
Apart from their own efficiency figures, PV systems work within the limited power density of their location's insolation. Average daily insolation (output of a flat plate collector at latitude tilt) in the contiguous US is 3-7 kilowatt·h/m²[90][91][92][93] and on average lower in Europe.
Solar cells produce DC which must be converted to AC (using a grid tie inverter) when used in current existing distribution grids. This incurs an energy loss of 4-12%.[94]
See also[]
- Active solar
- American Solar Energy Society
- Carbon nanotubes in photovoltaics
- Clean Energy Bank
- Concentrator photovoltaics
- Deployment of solar power to energy grids
- Distributed Energy Resources
- Distributed generation
- Electranet
- Green technology
- Grid-tied electrical system
- High efficiency solar cells
- History of photovoltaics
- Infrared
- Islanding
- Investment fund
- List of photovoltaics companies
- Maximum power point tracker
- Microgeneration
- Microgeneration Certification Scheme
- Photoelectrochemical cell
- Photovoltaic and renewable energy engineering in Australia
- Photovoltaic cell
- Photovoltaic module
- Photovoltaics in transport
- Renewable energy
- Renewable energy in the European Union
- Solar air conditioning
- Solar cell
- Solar energy
- Solar panel
- Solar thermal energy
- Solar Today
- Solar vehicle
- Solar-charged vehicle
- Thin-film solar cell
- World Council for Renewable Energy
References[]
- ↑ 1.0 1.1 Mark Z. Jacobson (2009). Review of Solutions to Global Warming, Air Pollution, and Energy Security p. 4.
- ↑ 2.0 2.1 2.2 German PV market
- ↑ BP Solar to Expand Its Solar Cell Plants in Spain and India
- ↑ Large-Scale, Cheap Solar Electricity
- ↑ Solar Expected to Maintain its Status as the World's Fastest-Growing Energy Technology
- ↑ 6.0 6.1 James Russell. Record Growth in Photovoltaic Capacity and Momentum Builds for Concentrating Solar Power Vital Signs, June 03, 2010.
- ↑ REN21 (2009). Renewables Global Status Report: 2009 Update p. 12.
- ↑ 8.0 8.1 8.2 http://www.renewableenergyworld.com/rea/news/article/2010/06/germany-to-raise-solar-target-for-2010-adjust-tariffs?cmpid=WNL-Friday-June4-2010
- ↑ GE Invests, Delivers One of World's Largest Solar Power Plants
- ↑ Building integrated photovoltaics
- ↑ Richard M. Swanson. Photovoltaics Power Up, Science, Vol. 324, 15 May 2009, p. 891.
- ↑ Boom and bust for Spain's heavily subsidized solar industry
- ↑ In India’s Sea of Darkness: An Unsustainable Island of Decentralized Energy Production
- ↑ MarketBuzz 2008: Annual World Solar Photovoltaic Industry Report
- ↑ World PV Industry Report Summary March 16, 2009 retrieved 28 March 2009
- ↑ Global Solar Photovoltaic Market Analysis and Forecasts to 2020
- ↑ Antonio Luque and Steven Hegedus (2003). Handbook of Photovoltaic Science and Engineering. John Wiley and Sons. ISBN 0471491969. http://books.google.com/books?id=u-bCMhl_JjQC&pg=PT326&ots=JCxK40jS5E&dq=wp+%22watts+peak%22+definition&sig=DCn_ieGxE81wn1kBMtowVsnrEPQ.
- ↑ The PVWatts Solar Calculator
- ↑ UtiliPoint International, Inc. 'Issue alert - What is a megawatt?
- ↑ Total electric power consumption
- ↑ Solar Generation V - 2008
- ↑ Company Information Overview
- ↑ The technology at a glance
- ↑ Converting sunlight to electricity
- ↑ A Better Way to Make Solar Power
- ↑ Solar Photovoltaic Panels
- ↑ MMA Renewable Ventures Solar Energy Program
- ↑ U.S. Retailers Save with Solar PV & Energy Efficiency
- ↑ Solar Power Services: How PPAs are Changing the PV Value Chain
- ↑ Berkeley FIRST retrieved 8 February 2008
- ↑ "SunPower claims new solar cell efficiency record of 24.2 percent". Before It's News. June 26 2010. http://beforeitsnews.com/news/86/728/SunPower_claims_new_solar_cell_efficiency_record_of_24.2_percent.html. Retrieved 26 June 2010.
- ↑ UD-led team sets solar cell record, joins DuPont on $100 million project retrieved 8 October 2008
- ↑ Sharp Develops Solar Cell with World's Highest Conversion Efficiency of 35.8%
- ↑ "Caltech Researchers Create Highly Absorbing, Flexible Solar Cells with Silicon Wire Arrays". California Institute of Technology. February 16, 2010. http://media.caltech.edu/press_releases/13325. Retrieved 7 March 2010.
- ↑ 35.0 35.1 35.2 PV Resources.com (2009). World's largest photovoltaic power plants
- ↑ FPL Commissions DeSoto Next Generation Solar Energy Center
- ↑ Portalenergia.es
- ↑ Germany Turns On World's Biggest Solar Power Project
- ↑ 39.0 39.1 Lieberose solar farm becomes Germany's biggest, World's second-biggest
- ↑ Juwi.de
- ↑ 41.0 41.1 Amareleja Solar Central solar which cost 261 ME started today (29 Dec 08) at full capacity
- ↑ Large photovoltaic plant in Muldentalkreis
- ↑ 43.0 43.1 Germany's largest Solar parks connected to the grid (19 Dec 08)
- ↑ Strickland, Tonya (2008-04-24). "$1 billion-plus Carrisa Plains solar farm could power 190,000 firms". The San Luis Obispo Tribune. http://www.sanluisobispo.com/178/story/341999.html. Retrieved 2008-08-19.
- ↑ 45.0 45.1 Sneed, David (2008-08-14). "Calif. utility agrees to buy solar power from two proposed plants". The San Luis Obispo Tribune. http://www.mcclatchydc.com/economics/story/48267.html. Retrieved 2008-08-15.
- ↑ 46.0 46.1 "PG&E Signs Historic 800 MW Photovoltaic Solar Power Agreements With Optisolar and Sunpower". Pacific Gas & Electric. 2008-08-14. http://www.pge.com/about/news/mediarelations/newsreleases/q3_2008/080814.shtml. Retrieved 2008-08-15.
- ↑ Building Integrated Photovoltaics, Wisconsin Public Service Corporation, accessed: 2007-03-23.
- ↑ SolidWorks Plays Key Role in Cambridge Eco Race Effort retrieved 8 February 2009
- ↑ "Solar water pumping". builditsolar.com. http://www.builditsolar.com/Projects/WaterPumping/waterpumping.htm. Retrieved June 16, 2010.
- ↑ Solar-Powered Parking Meters Installed
- ↑ Security Products, December 2006, p42
- ↑ Philadelphia's Solar-Powered Trash Compactors
- ↑ Solar loans light up rural India
- ↑ Off grid solutions for remote poor
- ↑ Rural Cuba Basks in the Sun
- ↑ Solar Roads attract funding
- ↑ Effect of Panel Temperature on a Solar-Pv Ac Water Pumping System
- ↑ Solar ABC
- ↑ Andrew Blakers and Klaus Weber, “The Energy Intensity of Photovoltaic Systems”, Centre for Sustainable Energy Systems, Australian National University, 2000.
- ↑ 60.0 60.1 60.2 60.3 Alsema, E.A.; Wild - Scholten, M.J. de; Fthenakis, V.M. Environmental impacts of PV electricity generation - a critical comparison of energy supply options ECN, September 2006; 7p. Presented at the 21st European Photovoltaic Solar Energy Conference and Exhibition, Dresden, Germany, 4–8 September 2006.
- ↑ Joshua Pearce and Andrew Lau, “Net Energy Analysis For Sustainable Energy Production From Silicon Based Solar Cells”, Proceedings of American Society of Mechanical Engineers Solar 2002: Sunrise on the Reliable Energy Economy, editor R. Campbell-Howe, 2002.
- ↑ Solar Energy Technologies Program pp. 52, 53 retrieved 28 March 2009
- ↑ EERE's Consumer Guide: Siting Your Small Solar Electric System
- ↑ Reflective mirrors seen raising solar potential, Ari Rabinovitch, Reuters, August 10, 2007 retrieved 8 February 2009
- ↑ Zenith Solar’s Light of a Thousand Suns, Green Prophet, December 17, 2007.
- ↑ At the Zenith of Solar Energy, Neal Sandler,BusinessWeek, March 26, 2008.
- ↑ Going for grid parity 2005 article
- ↑ "Gaining on the grid". BP. http://www.bp.com/sectiongenericarticle.do?categoryId=9019305&contentId=7035199.
- ↑ "The Path to Grid Parity". BP. http://www.bp.com/popupimage.do?img_path=liveassets/bp_internet/globalbp/globalbp_uk_english/reports_and_publications/frontiers/STAGING/local_assets/images/fr19solar_parity570x417.jpg%20&alt_tag=Graphic%20about%20grid%20parity,%20when%20the%20cost%20of%20solar%20energy%20equals%20that%20of%20grid%20electricity.
- ↑ Reuters.com
- ↑ 71.0 71.1 The True Cost of Solar Power retrieved 22 October 2008
- ↑ Abengoa Solar retrieved 22 October 2008
- ↑ Solar Rebate Program
- ↑ China Racing Ahead of America in the Drive to Go Solar.
- ↑ Approved — Feed-in tariff in Israel.
- ↑ OJA-services.nl
- ↑ Powerauthority.on.ca
- ↑ 3rd International Conference on Solar Photovoltaic Investments
- ↑ 79.0 79.1 79.2 79.3 Fridleifsson,, Ingvar B.; Bertani, Ruggero; Huenges, Ernst; Lund, John W.; Ragnarsson, Arni; Rybach, Ladislaus (2008-02-11). O. Hohmeyer and T. Trittin. ed (pdf). The possible role and contribution of geothermal energy to the mitigation of climate change. Luebeck, Germany. pp. 59–80. http://iga.igg.cnr.it/documenti/IGA/Fridleifsson_et_al_IPCC_Geothermal_paper_2008.pdf. Retrieved 2009-04-06.
- ↑ Lund, John W. (June 2007). "Characteristics, Development and utilization of geothermal resources". Geo-Heat Centre Quarterly Bulletin (Klamath Falls, Oregon: Oregon Institute of Technology) 28 (2): pp. 1–9. ISSN 0276-1084. http://geoheat.oit.edu/bulletin/bull28-2/art1.pdf. Retrieved 2009-04-16.
- ↑ "IPCC Fourth Assessment Report: 4.3.2 Nuclear energy". IPCC Fourth Assessment Report: Climate Change. The Nobel Foundation. 2007. http://www.ipcc.ch/publications_and_data/ar4/wg3/en/ch4s4-3-2.html. Retrieved 19 February 2010.
- ↑ Solar Energy Facts
- ↑ 83.0 83.1 Vaclav Smil - Energy at the Crossroads
- ↑ Environmental Aspects of PV Power Systems
- ↑ U.S. Climate Change Technology Program - Transmission and Distribution Technologies
- ↑ World Record: 41.1% efficiency reached for multi-junction solar cells Fraunhofer ISE
- ↑ solarcellsinfo.com
- ↑ Berkeley FIRST retrieved 4 February 2009
- ↑ DOE.gov
- ↑ Insolation figures of 3-7 kilowatt·h/m² for the contiguous US are from the map colors which slightly contradict the table above which claims 900 to 2100 yearly insolation, that makes 2.46 to 5.7 daily. Also, second cite does not claim 3 or 7, third cite also makes no mention. There is also a need to clarify what kind of insolation is meant, presumably vertical.
- ↑ NREL Map of Flat Plate Collector at Latitude Tilt Yearly Average Solar Radiation See also NREL.gov
- ↑ Solar Energy Technologies Program: Solar FAQs US Department of Energy. Retrieved on 24 August 2007,
- ↑ Solar panel achieves high efficiency
- ↑ Renewable Resource Data Center - PV Correction Factors
SUPPLEMENTAL REFERENCES
- H. Hovel, "Semiconductors & Semimetals, Volume II, Solar Cells," Academic Press, N. Y., 1975;
- Bachmann et al., "Preparation of P-Type InP -- Vapor Deposition."J. Electrochem. Soc., vol. 123, No. 10, Oct. 1976, pp. 1509–1513;
- Fraas et al., "InP Epitaxial Thin-Film -- Reactive Deposition", Applied Physics Letters, vol. 28, No. 8, Apr. 15 1976, pp. 415–417;
- K. J. Bachmann et al., "Polycrystalline Thin-Film InP-CdS Solar Cells", Appl. Phys. Letters, vol. 29, No. 2, July 1976, pp. 121–123.
United States Patents;
- T102,801 Silicon solar cell;
- 4,329,534 Uniform incident light high voltage solar cell array;
- 4,292,461 Amorphous-crystalline tandem solar cell;
- 4,289,920 Multiple bandgap solar cell on transparent substrate;
- 4,276,137 Control of surface recombination loss in solar cells;
- 4,202,704 Optical energy conversion;
- 4,178,195 Semiconductor structure;
- 4,122,476 Semiconductor heterostructure
External links[]
| This article's use of external links may not follow Wikipedia's policies or guidelines. Please improve this article by removing excessive and inappropriate external links or by converting links into footnote references. (August 2009) |
Photovoltaic industry associations[]
- (Spanish) ASIF: Spanish PV Industry Association
- (Italian) GIFI: Italian PV Industry Association
- (French) SER: French Renewable Energy Union
- Template:De icon BSW: German Solar Industry Association, (with English summary)
- HELAPCO: Hellenic Association of Photovoltaic Companies
- GUNESE: Turkish Association of Photovoltaic Companies
- CANSIA: Canadian Solar Industry Association
- EPIA: European Photovoltaic Industry Association
- IPVEA: International Photovoltaic Equipment Association
- Template:Ja icon JPEA: Japanese Photovoltaic Energy Association
- SEIA: Solar Energy Industries Association US trade association
- SEMI: Semiconductor Equipment and Materials International Global industry association
Photovoltaics research institutes[]
There are many research institutions and departments at universities around the world who are active in photovoltaics research. Countries which are particularly active include Germany, Spain, Japan, Australia, China, and the US.
- Some universities and institutes which have a photovoltaics research department
Europe
- Ecole Polytechnique Fédérale de Lausanne Prof. Graetzel invented dye sensitized cells here
- Advanced Energy Systems at Helsinki University of Technology
- Institute of Materials Research, Salford University
- The Centre for Electronic Devices and Materials at Sheffield Hallam University
- School of Photovoltaic and Renewable Energy Engineering
- Solar Energy Laboratory at University of Southampton
- Institut für Solare Energiesysteme ISE at the Fraunhofer Institute
- Institut für Energieforschung / Forschungszentrum Jülich (IEF-5 Photovoltaik)
- Energy research Centre of the Netherlands (ECN)
- Imperial College London: Experimental Solid State Physics
- Instituto de Energía Solar, at Universidad Politécnica de Madrid
- Centre for Renewable Energy Systems Technology, at Loughborough University
- Institute of microtechnology at University of Neuchatel Switzerland
- University of Konstanz
- Linz Institute for Organic Solar Cells (LIOS) at Linz, Austria
- World Alliance for Decentralized Energy based in Edinburgh, United Kingdom and Washington, D.C., US
- Renewable Energy research Centre of the Türkey based in Isparta, Türkey
- Photovoltaic Materials and Devices group at the Delft University of Technology
North America
- Arizona State University Photovoltaic Testing Laboratory
- Solar Energy Materials Research Group at Lawrence Berkeley National Laboratory
- Energy & Environmental Technology Application Center at the College of Nanoscale Science and Engineering SUNY at Albany
- The Center for Functional Nanomaterials at Brookhaven National Laboratory, New York, US
- National Renewable Energy Laboratory NREL at Golden, Colorado and Washington, D.C., US
- The Centre for Advanced Investigations on Electric Engineering at The National Polytechnic Institute of Mexico
- The Solar Caliometry Lab at Queen's University, Kingston, Canada
- Arizona Research Institute for Solar Energy
- Institute of Energy Conversion at University of Delaware
- Center for Advanced Photovoltaic Devices and Systems (CAPDS) at The University of Waterloo, Canada
- Florida Solar Energy Center at University of Central Florida
Australia
- Centre for Sustainable Energy Systems at the Australian National University
- School of Photovoltaic and Renewable Energy Engineering[1] at the University of New South Wales
- Data sources
- EU PV Technology Platform - forum for stakeholders to influence EU policy
- Trends in photovoltaic applications in selected IEA countries between 1992 and 2004
- IEA PVPS annual report 2008
- Photovoltaic Geographical Information System (PVGIS)
- US Department of Energy - Energy Efficiency and Renewable Energy
- DSIRE Listing of US state, local, utility, and federal incentives for renewable energy and energy efficiency.
- Solar calculator for Europe and Africa European Commission Joint Research Centre
- Solar Panel Savings Measurement Tool Check how much money we will actually save by installing solar panels on our rooftop
- Solar Photovoltaic Industry - Looking through the storm A PV business/industry model assessment and supply/demand forecast through 2010.
Template:Solar energy
af:Fotovoltaïese energie
ar:لوح ضوئي
ca:Energia solar fotovoltaica
cs:Fotovoltaika
de:Photovoltaik
el:Φωτοβολταϊκά
es:Energía solar fotovoltaica
eo:Fotovoltaiko
eu:Eguzki-energia fotovoltaiko
fa:فتوولتاییک
fr:Énergie solaire photovoltaïque
ko:태양광 발전
id:Fotovoltaik
it:Impianto fotovoltaico
ms:Fotovoltan
nl:Fotovoltaïsche cel
ja:太陽光発電
pl:Fotowoltaika
pt:Célula fotoelétrica
ru:Фотовольтаика
sc:Fotovoltàicu
sk:Fotovoltaický článok
sl:Fotovoltaika
sv:Fotovoltaik
ta:ஒளிமின்னழுத்தியம்
tr:Fotovoltaik
vi:Điện mặt trời
zh:太阳能光伏